
Entering spring 2025
A quick update on the impact of solar in the EU at the start of spring

Solar is arriving
It has been quite sunny the last few days and a new record on instantaneous solar generation has been broken in Germany, according to data published on energy-charts. On 3 April, solar generation was above 46 GW, while the load at that moment was 58 GW.

The total solar generation for March has also been much better, reaching 6.6 TWh, compared to just 4.6 TWh in the same month in 2024
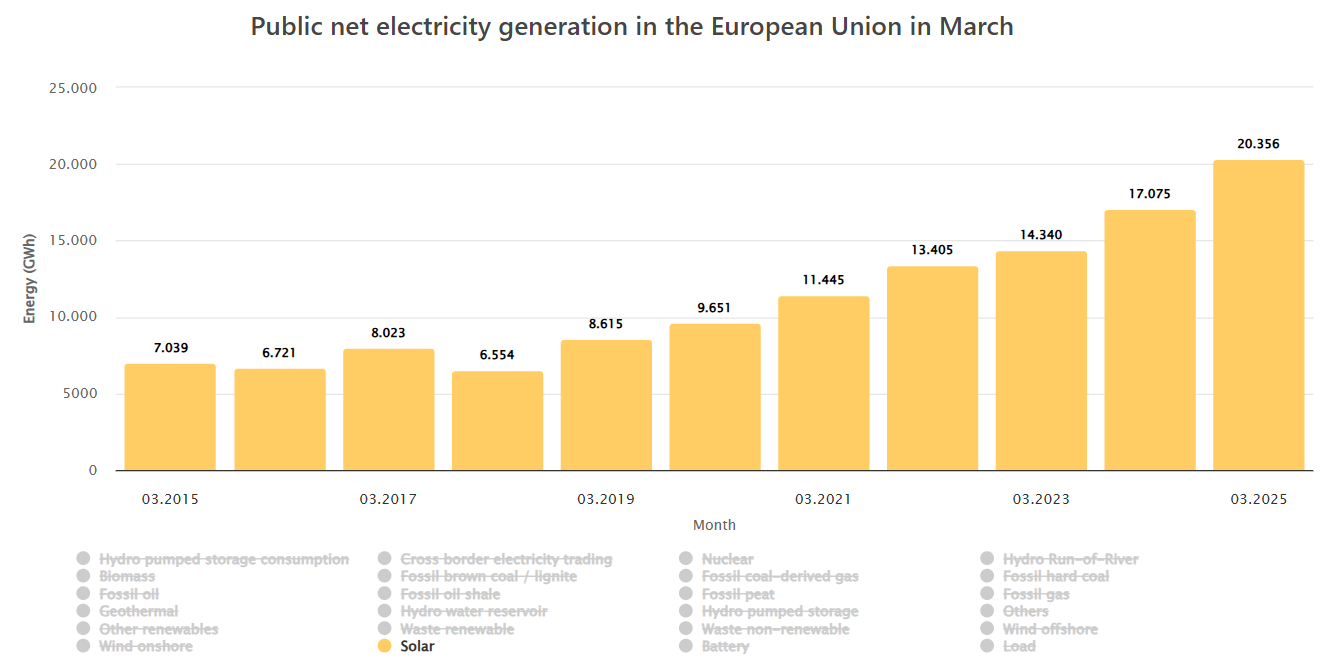
At the EU level, solar generation reached 20.4 TWh, more than 3 TWh more than March 2024, or almost 20% more. March is still relatively early in the season, and we should expect much larger solar generation in the coming months (from May to August, solar generation was between 28.9 TWh to 32.4 TWh in 2024).
Impact on the day-ahead price
Clearly, the substantial solar generation is significantly impacting power prices. For instance, here are the day-ahead prices from 11 AM to 2 PM on Saturday, April 5th. Prices are negative or zero nearly everywhere, except in some countries such as Italy, Norway and the UK.

Much deeper duck curves
Zooming out focusing on averages only, it is possible to show the impact of solar on the month of March by considering the normalized average prices. The normalized are calculated by dividing the hourly averages by the monthly averages, in order to focus on the solar effect only.
As we can see below for 4 countries (France, Poland, Belgium, and Netherlands), the effect has been much larger in 2025 than in previous years.

Dropping solar capture rates
Regarding the solar capture rate, we observed a substantial drop in March 2025 compared to previous years. In Germany, it was just 53%, with the solar capture price around 50 €/MWh versus an average market price of 95 €/MWh (German day-ahead price).
This is notably lower than previous years, which saw a capture rate of 77% in March 2024, and consistently above 80% from 2021 to 2023. The only exception was May 2024, which had a lower capture rate of 49%, while July and August 2024 had similar levels at 53%. The graph below illustrates the evolution of the monthly solar capture rate in Germany since 2021.

What to expect in the coming months?
While solar irradiation will obviously play a key role, we can anticipate that these indicators may continue to decline. Here are a few elements to watch:
The appetite for more solar capacity: Will installed solar capacity remain at similar levels to 2023 and 2024 (approximately 60 GW of new solar capacity in the EU), or will it increase or decrease?
The daily spread: How much will the daily spreads widen, especially given the extreme prices observed in some countries last summer?
The solar capture rate: will we reach solar capture rates below 40% or even 30% this year?
Negative hours: how many negative hours will we experience this year?
Stay tuned for more updates in the coming months!