
Updates on France

France occupies a unique position in the global electricity landscape. Few countries operate such a large nuclear fleet capable of delivering stable, low‑carbon power while exporting significant volumes to the rest of Europe. In this post, I focus specifically on the French power system and highlight several insights from 2025—covering production trends, price dynamics, value of generation assets, expectations for the coming years, and a few reflections on France’s balancing1.
Let’s have a look.
France as a superpower for electricity export
In 2025, France acted as a major exporter for Europe. Although it occasionally imported electricity on certain borders, it remained a net exporter nearly 99% of the time2.
France’s exports do not only benefit its immediate neighbors. In 2025, 15% of French electricity exports supplied non‑bordering countries3.
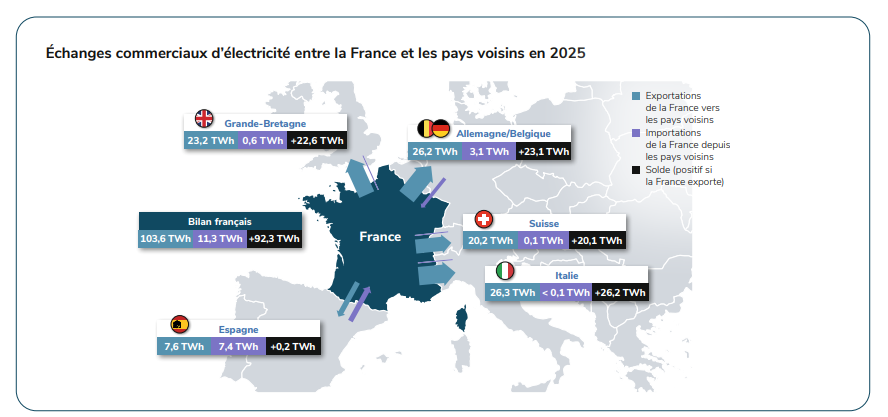
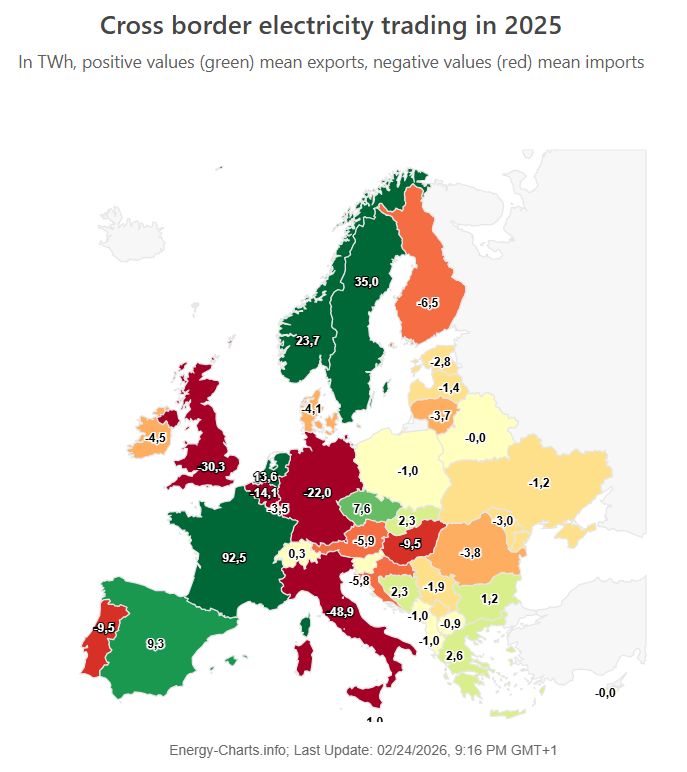
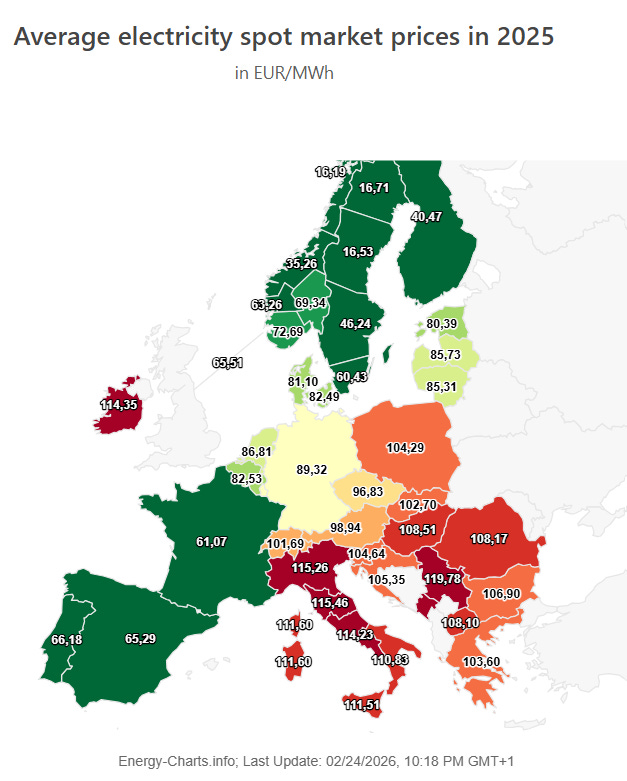
Looking at Europe as a whole, the scale of French exports becomes striking: France exported 92.5 TWh out of 547 TWh produced in 2025—meaning that 17% of all electricity generated was exported. This volume exceeds the entire annual electricity consumption of Belgium or Switzerland, and France exported almost as much electricity as all other European exporters combined. Unsurprisingly, such abundant low‑carbon supply, coupled with relatively modest domestic demand, results in French wholesale prices being among the lowest in Europe, surpassed only by some regions of the Nordic countries.
How is electricity produced in France?
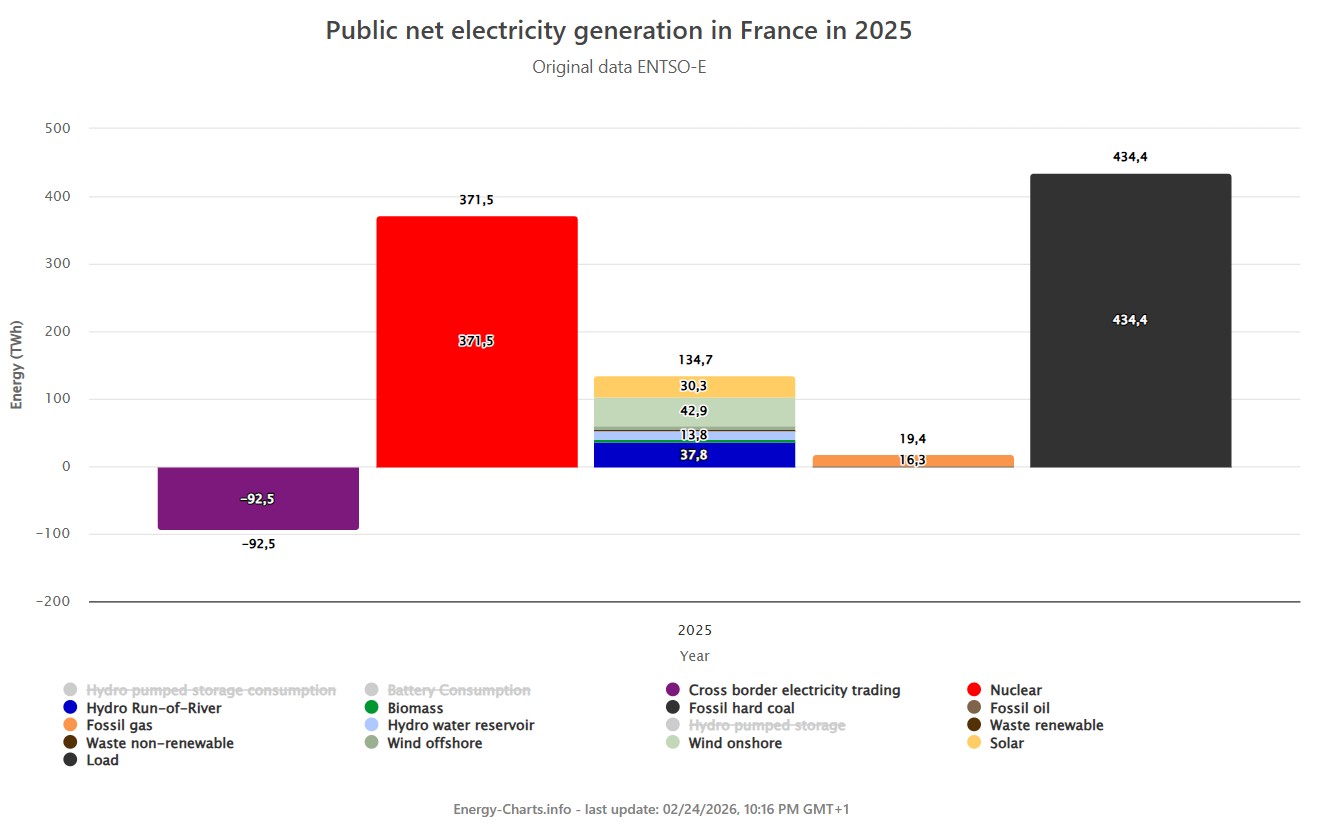
In 2025, France generated roughly 547 TWh of electricity with an exceptionally clean mix dominated by low‑carbon sources. Nuclear power remained the backbone of the system, providing about 70% of total output and returning to near pre‑crisis production levels. Hydropower accounted for around 11%, reverting to its long‑term average after an unusually high year in 2024. Wind contributed roughly 9%, though performance was constrained by the lowest capacity factor in a decade due to weak wind conditions. Solar reached about 6% and delivered the strongest growth thanks to continued capacity expansion and favorable sunlight conditions. Fossil fuels supplied less than 5% of total electricity, underscoring France’s status as one of Europe’s cleanest and most reliable power producers in 2025.
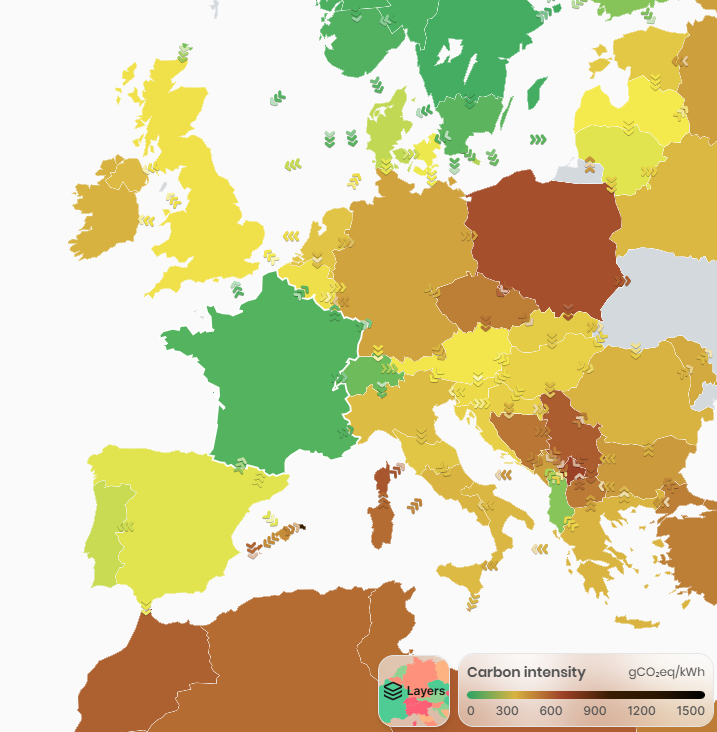
The exceptional French mix can also be seen in the emission map here below. Only Nordics country, Switzerland and Albania have a carbon intensity below 100 gCO2eq/kwh, according to electricity maps.
How were the day-ahead prices?
Before examining prices, it’s essential to understand the demand side. In 2025, electricity consumption in France remained broadly stable relative to the previous year, reaching 451 TWh (+0.4% vs. 2024). After the sharp declines triggered by the 2022–2023 energy crisis, the downward trend halted in 2024. Nevertheless, demand in 2025 remains roughly 6% below pre‑crisis levels (2014–2019).
In this context of persistently subdued demand and abundant low‑marginal‑cost generation (nuclear, hydro, wind, and solar), wholesale electricity prices have stayed depressed—indeed, lower than in any neighboring country.
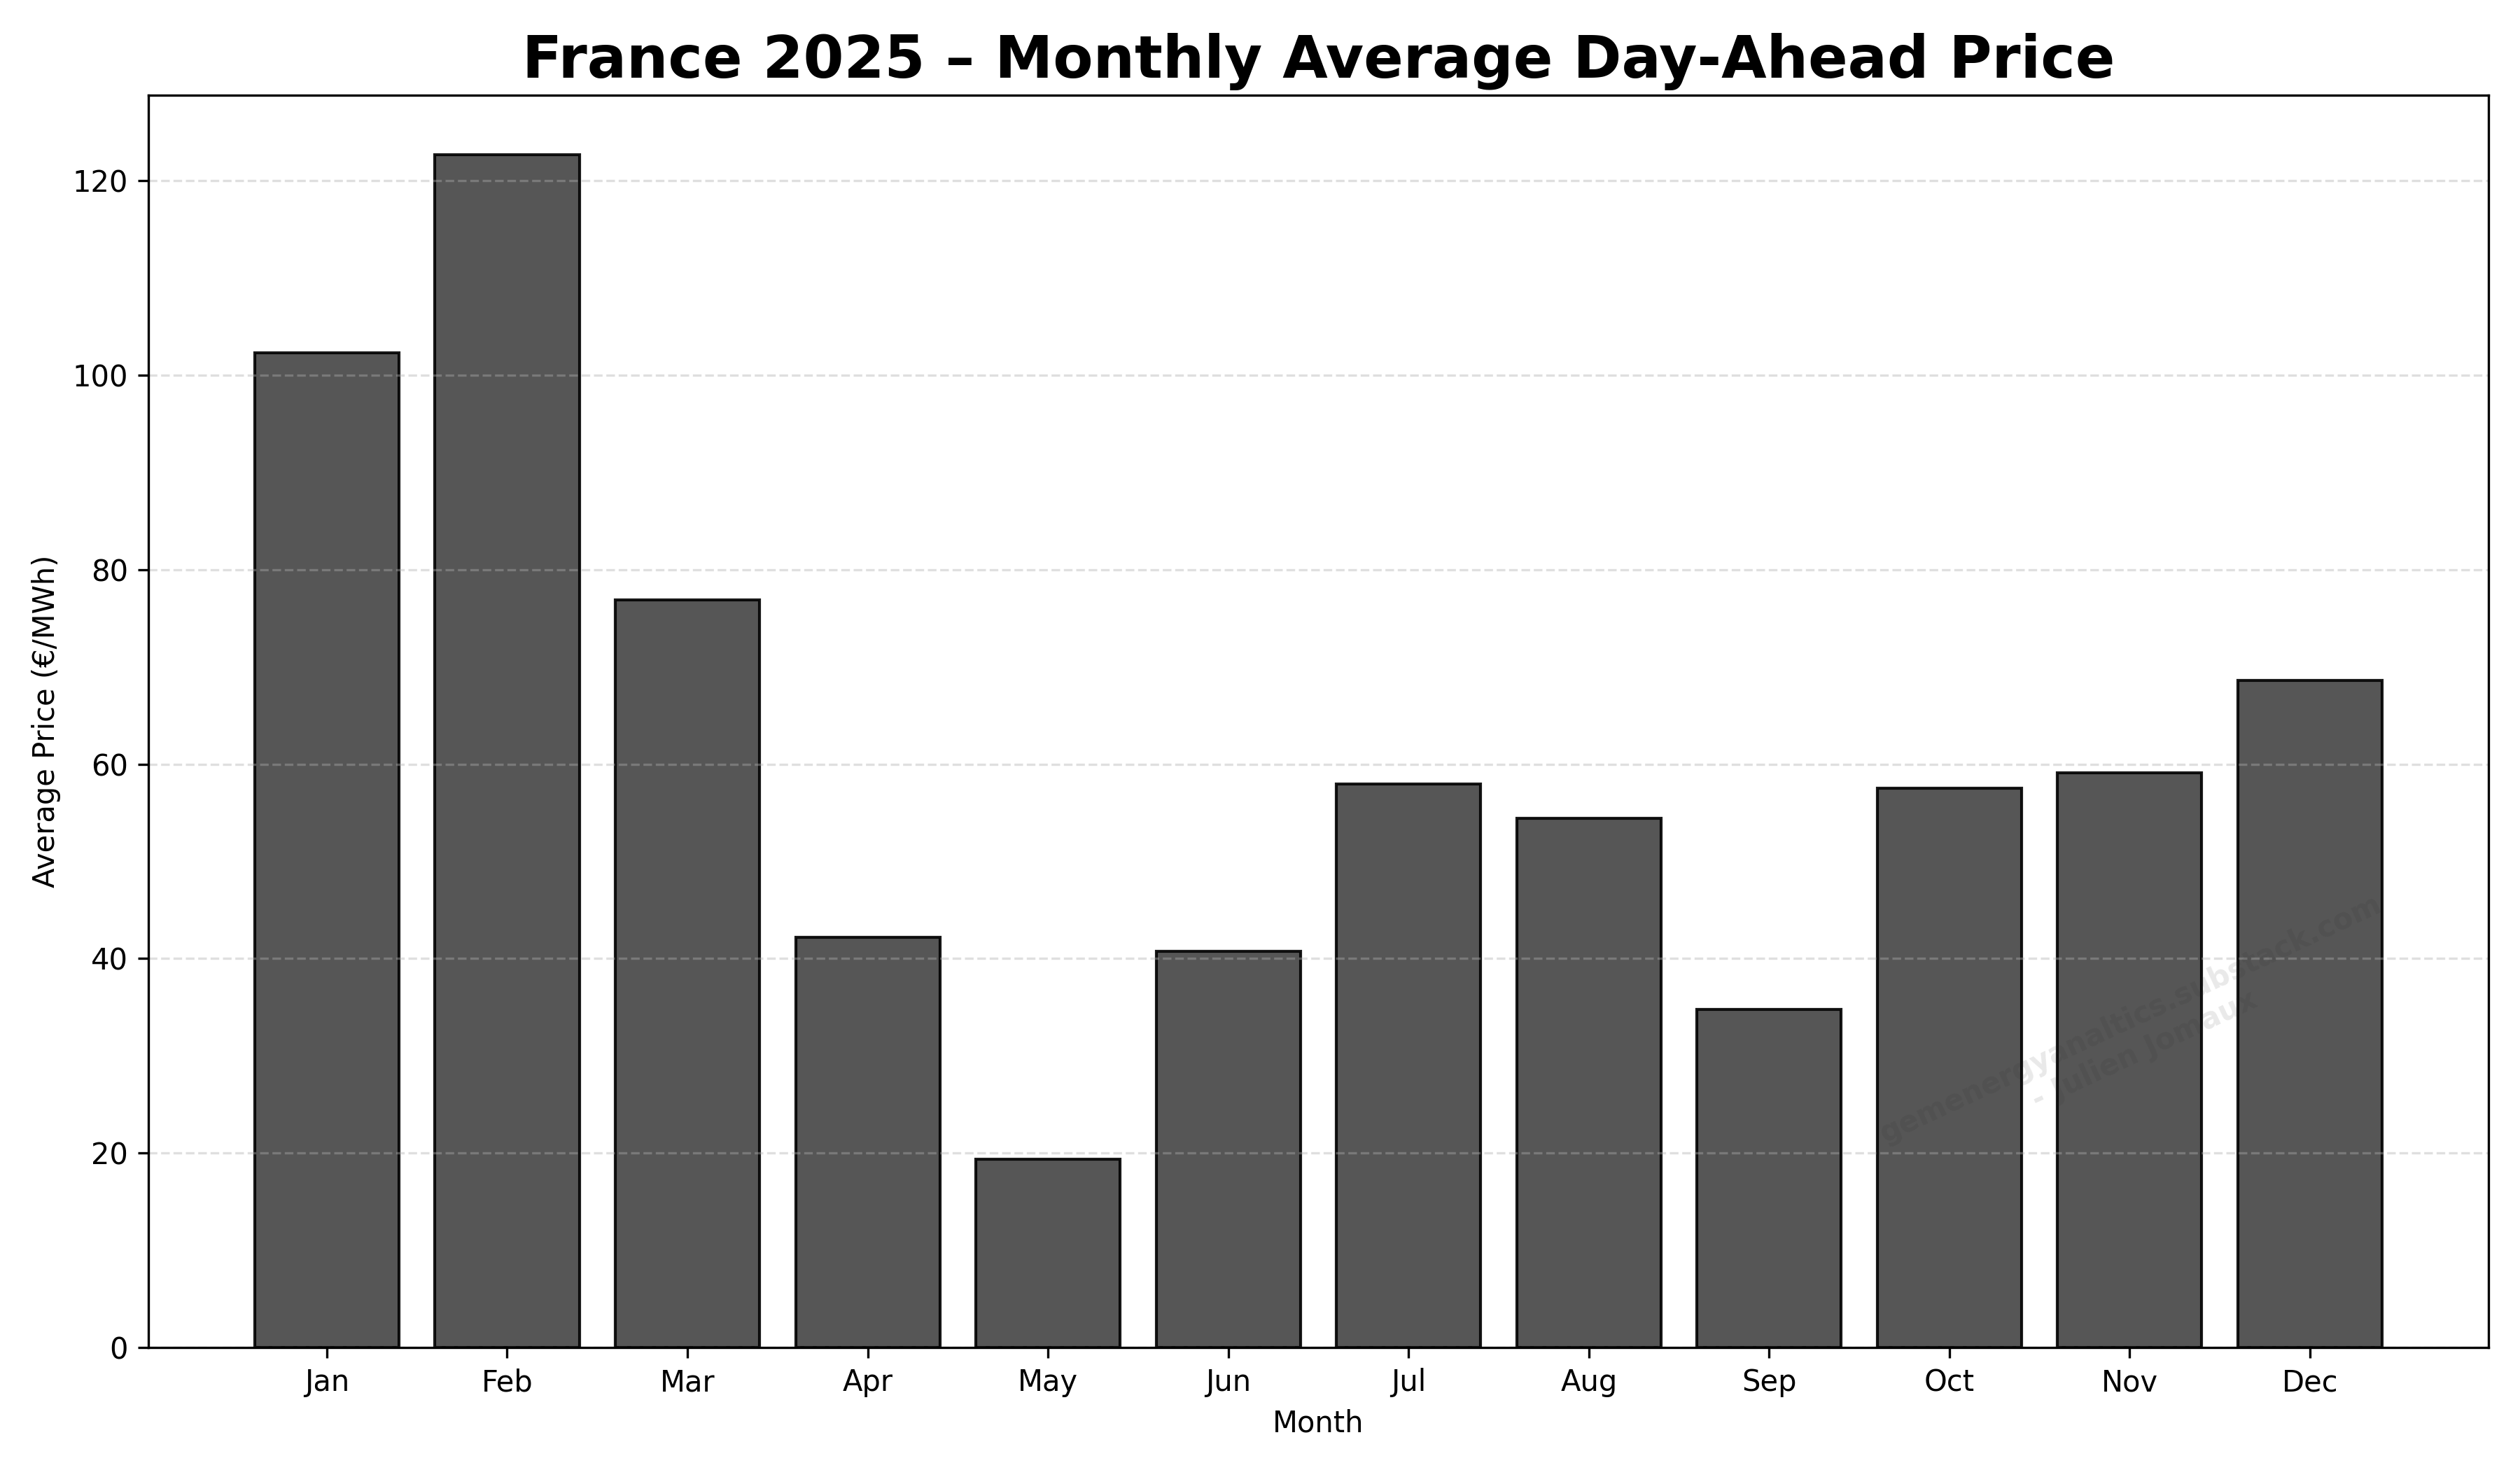
Of course, these figures reflect an annual average, and the monthly pattern reveals substantial volatility. The contrast between winter and spring is particularly striking: prices fell sharply from over 120 €/MWh in February to around 20 €/MWh in May. As we will discuss later, this abrupt drop has significant implications for the capture prices of all generation technologies.
Nuclear in 2025
Nuclear generation rose to 373 TWh in 2025, recovering to near‑2019 levels due to better reactor availability. At the same time, operating patterns shifted: reactors now reduce output more often during midday in spring and summer, instead of mainly at night or on weekends as in the past.
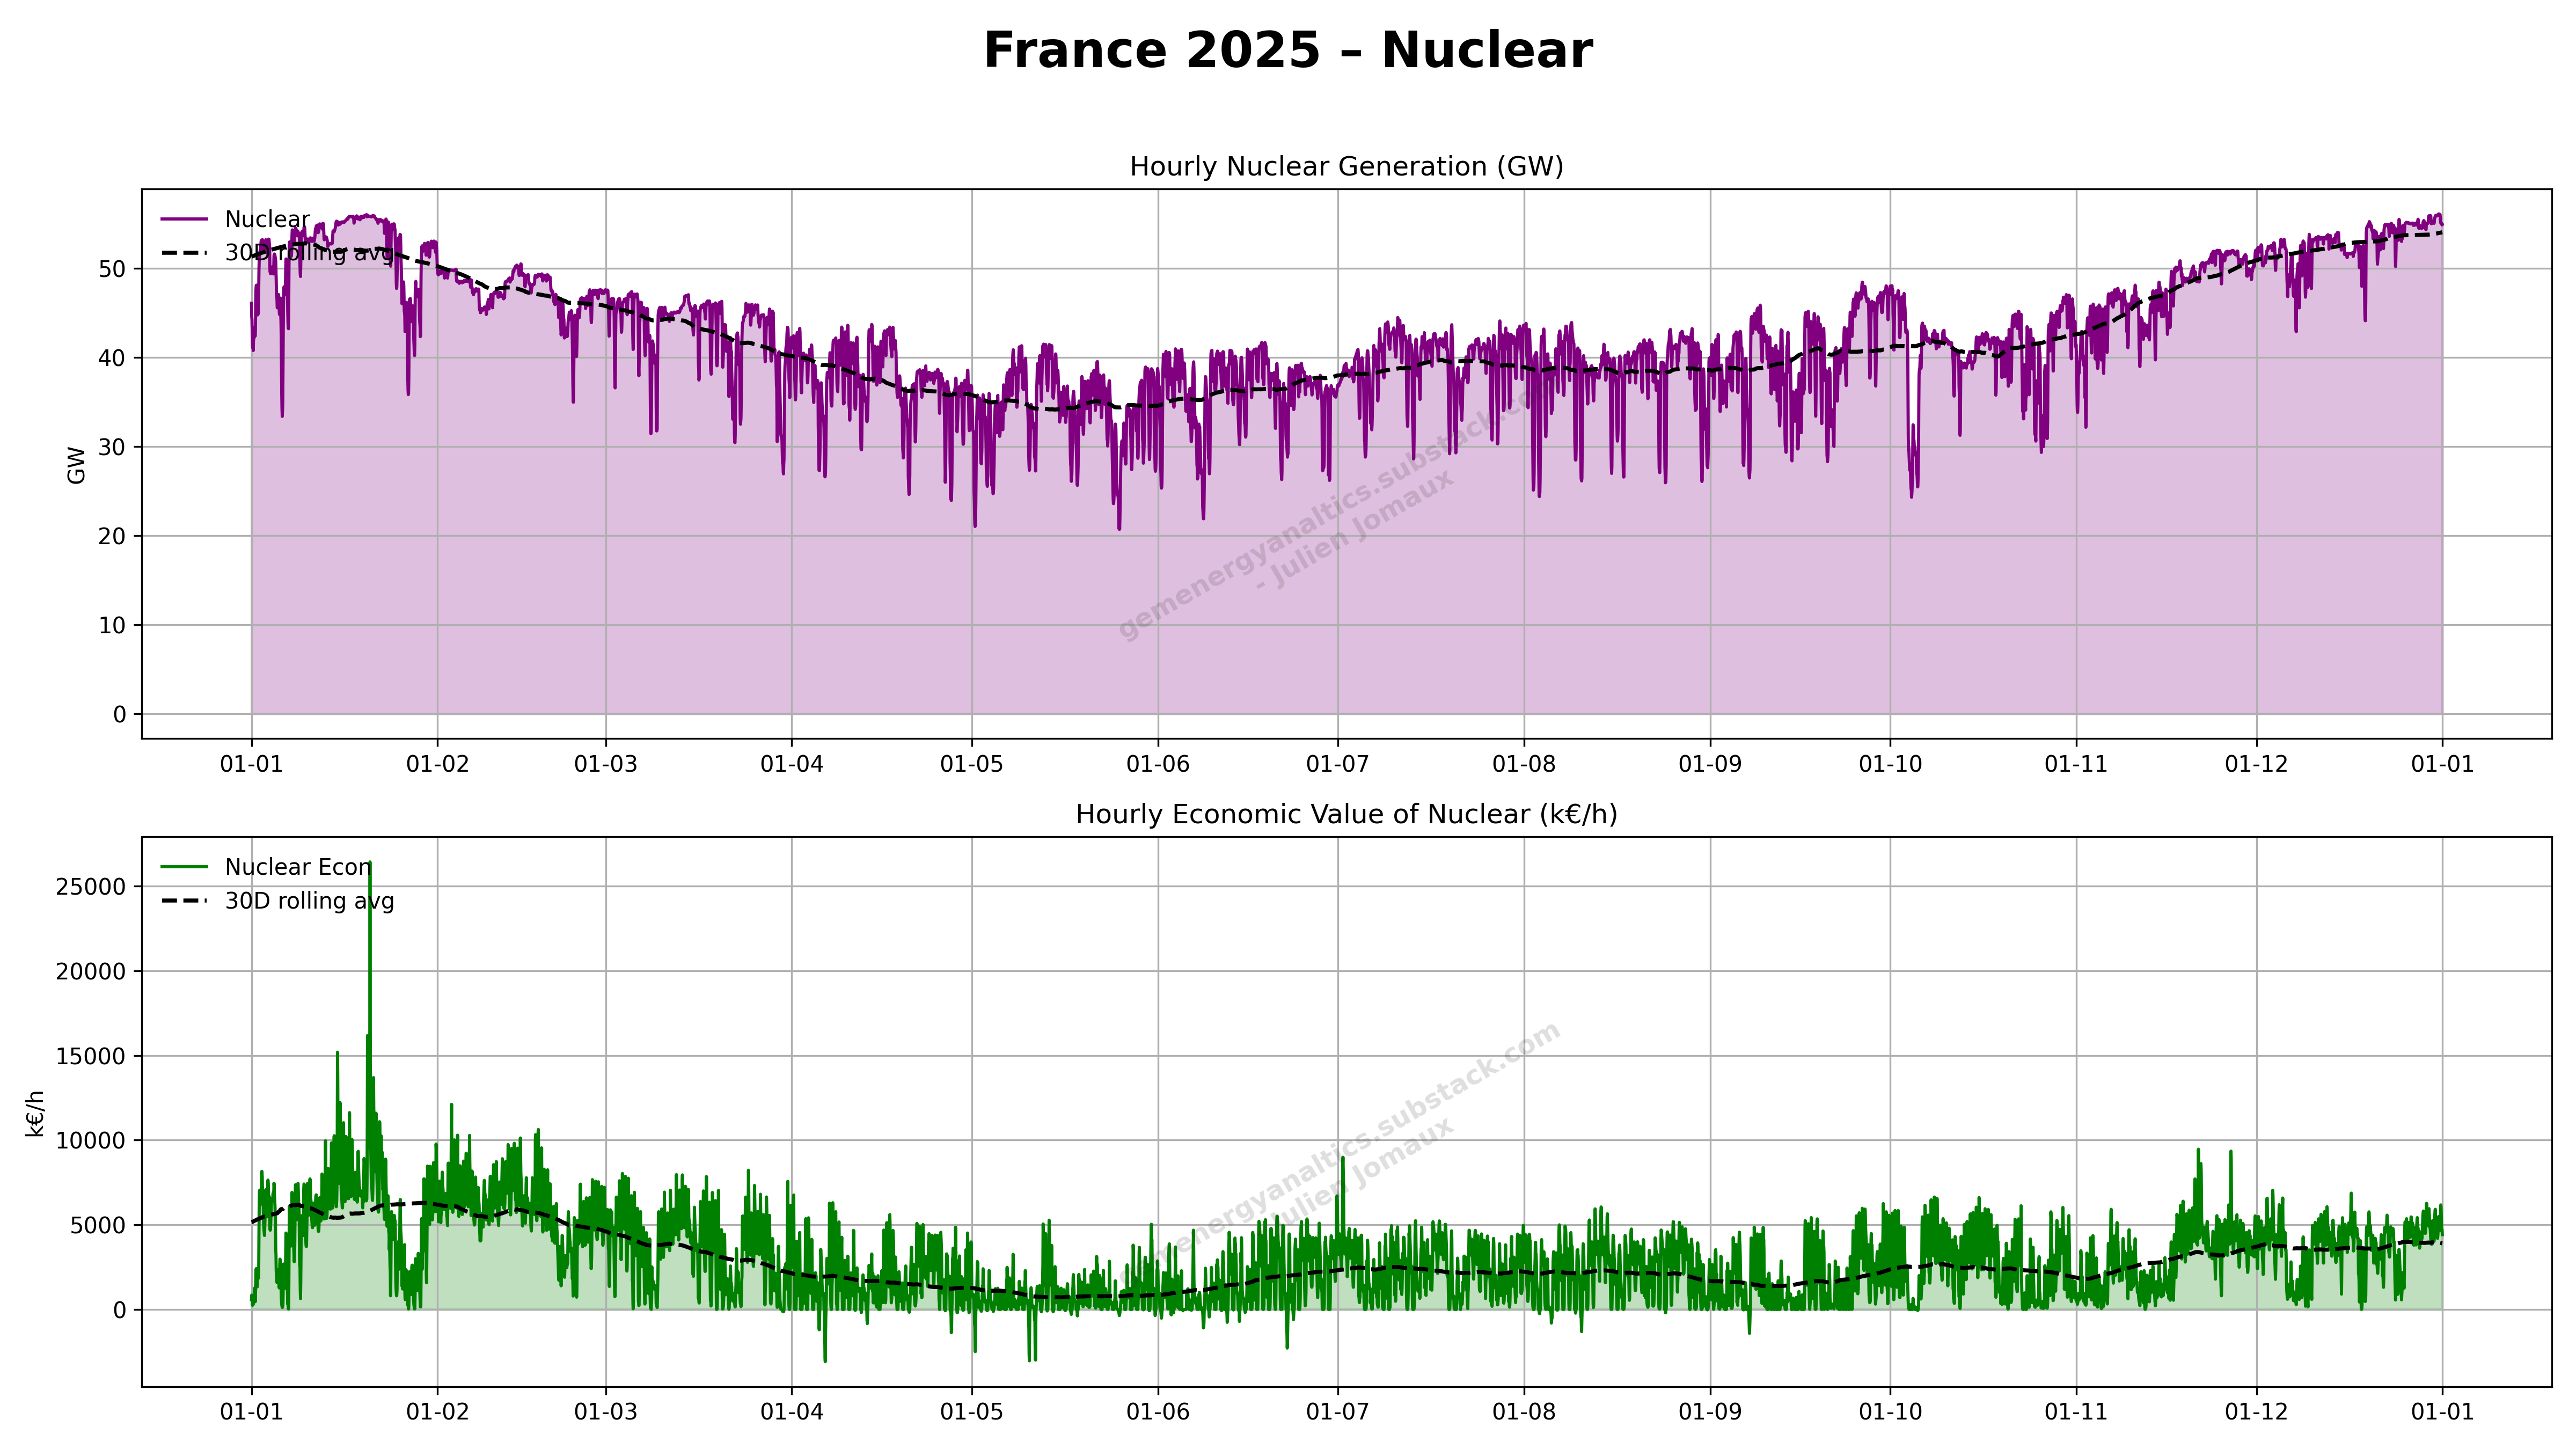
Hereunder, we can see the production levels of nuclear, as well as the corresponding economic value. First graph is hour by hour.
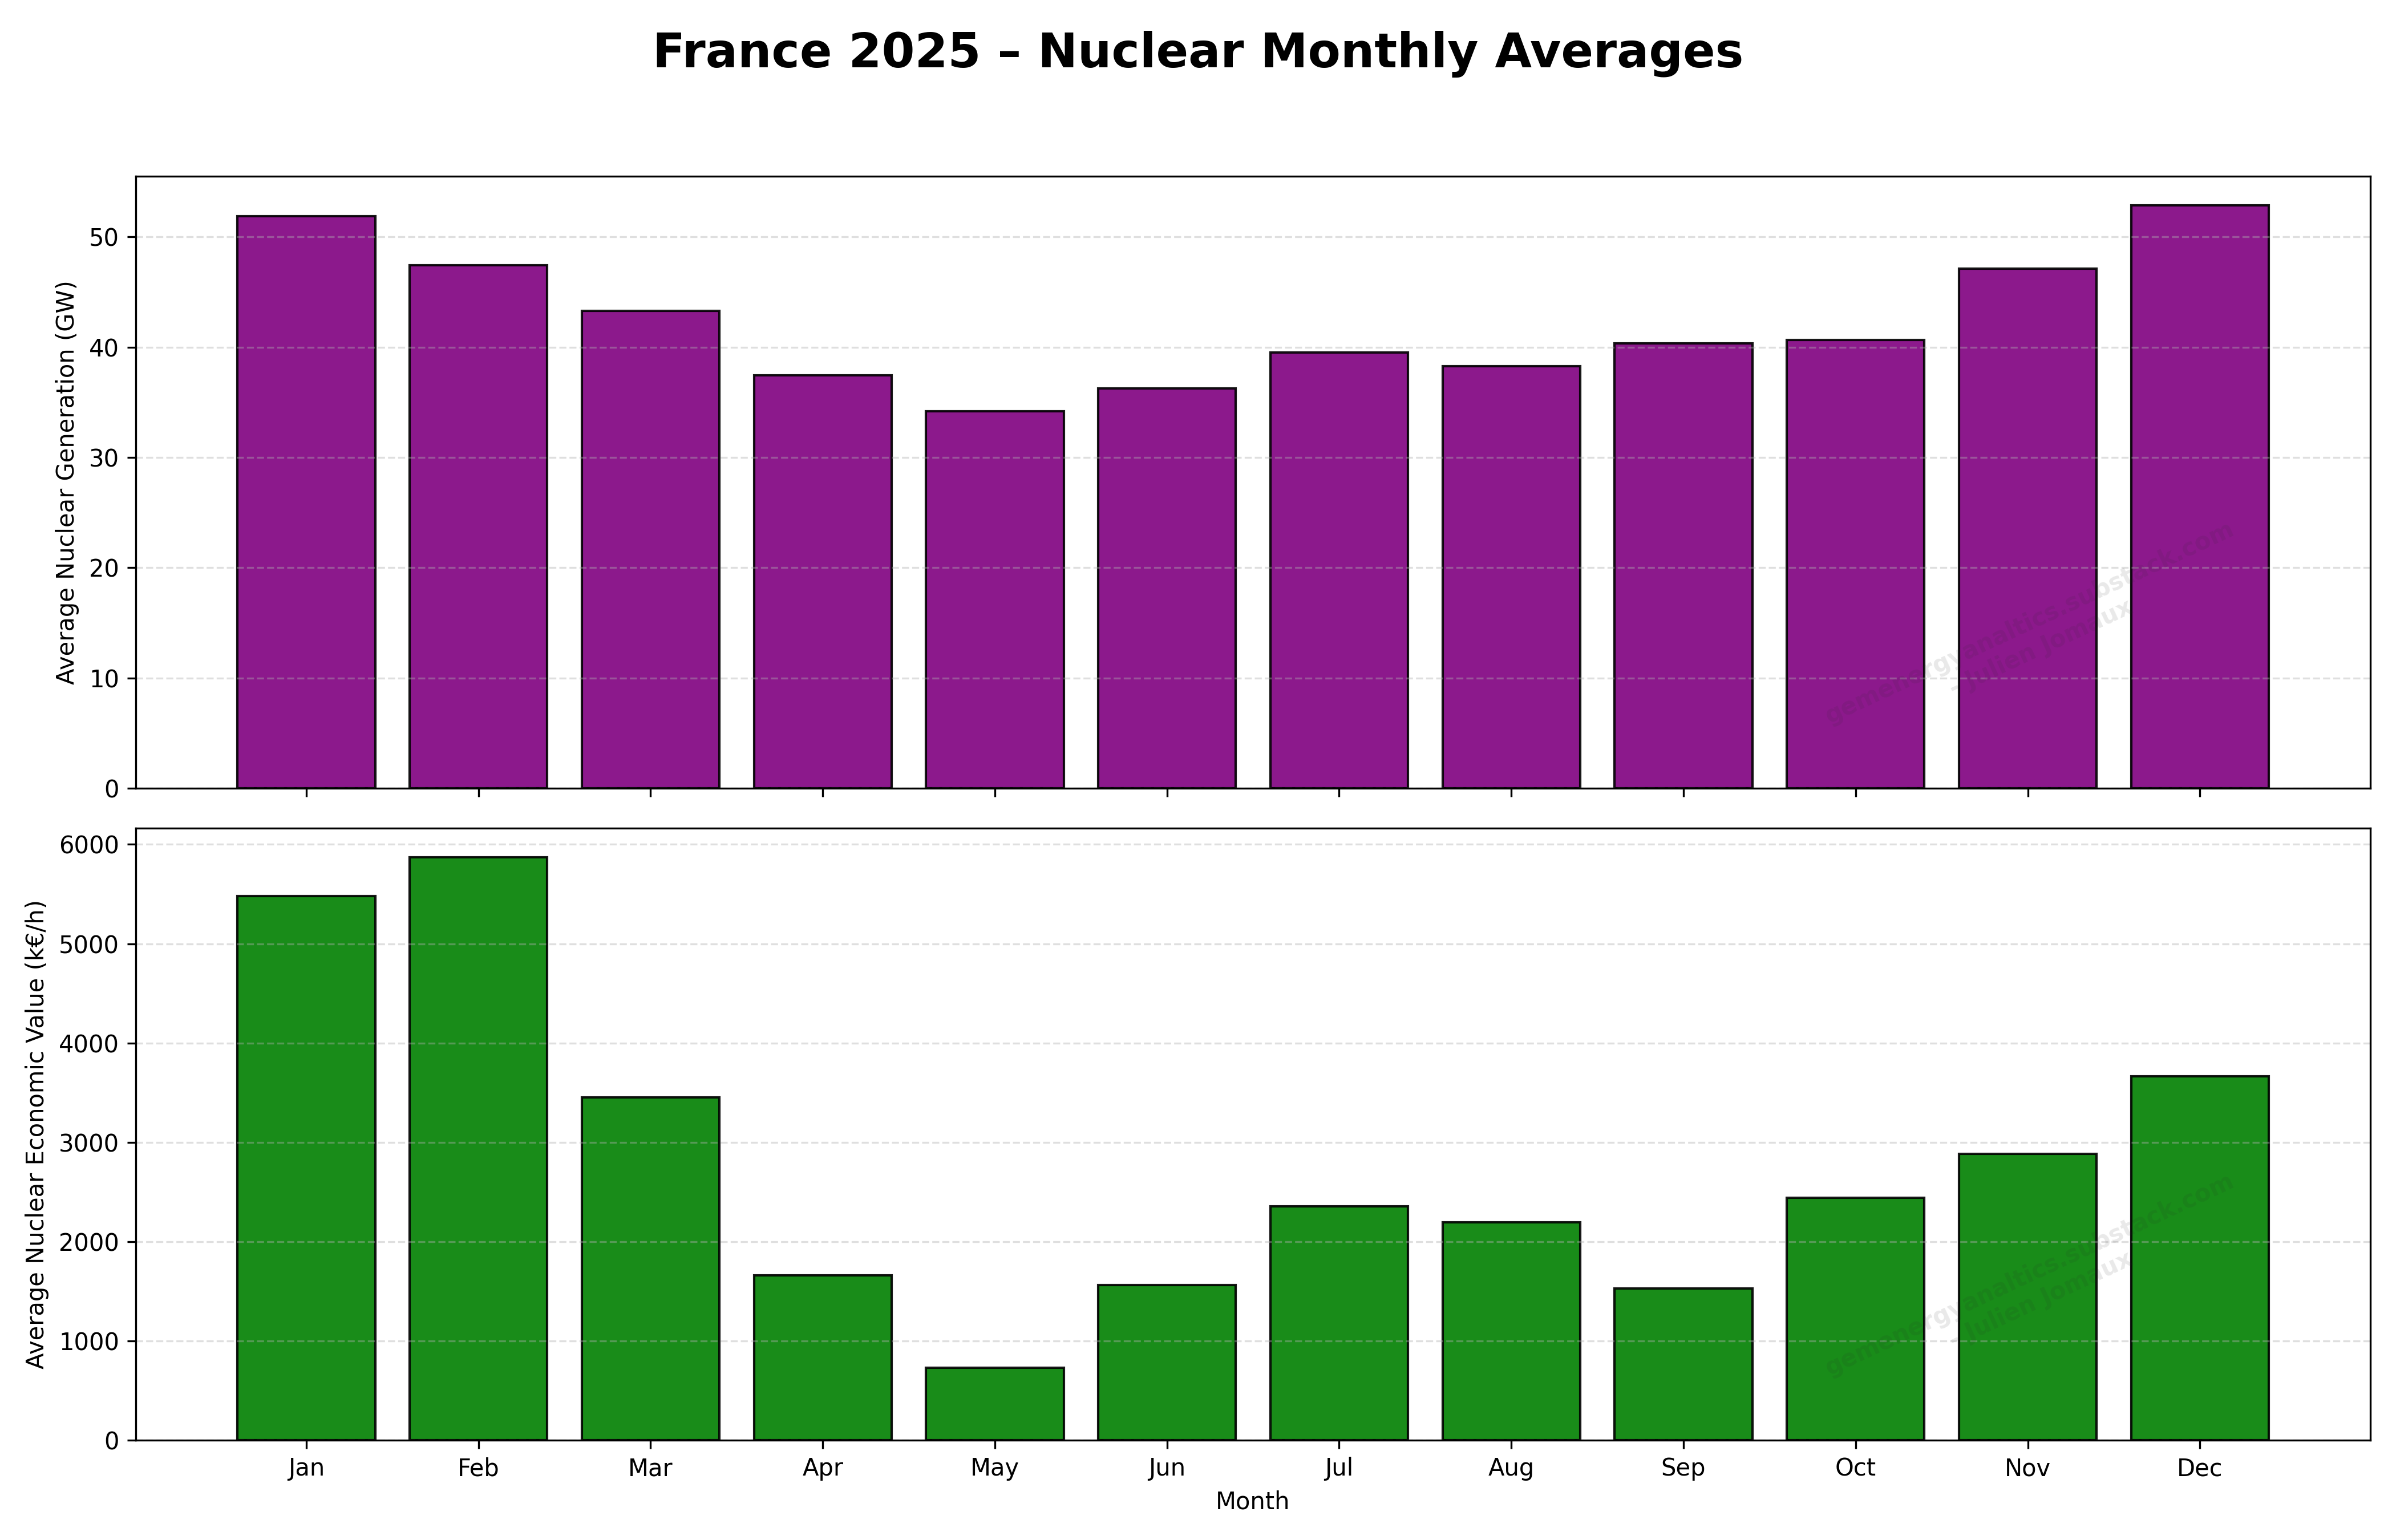
The second graph presents the same information but aggregated on a monthly basis. As expected, the economic value—expressed in k€ per hour—is significantly higher in February than in the months from April to June or in September. This pattern directly reflects the decline in average day‑ahead prices shown earlier, with winter months benefiting from much stronger price signals than the rest of the year.
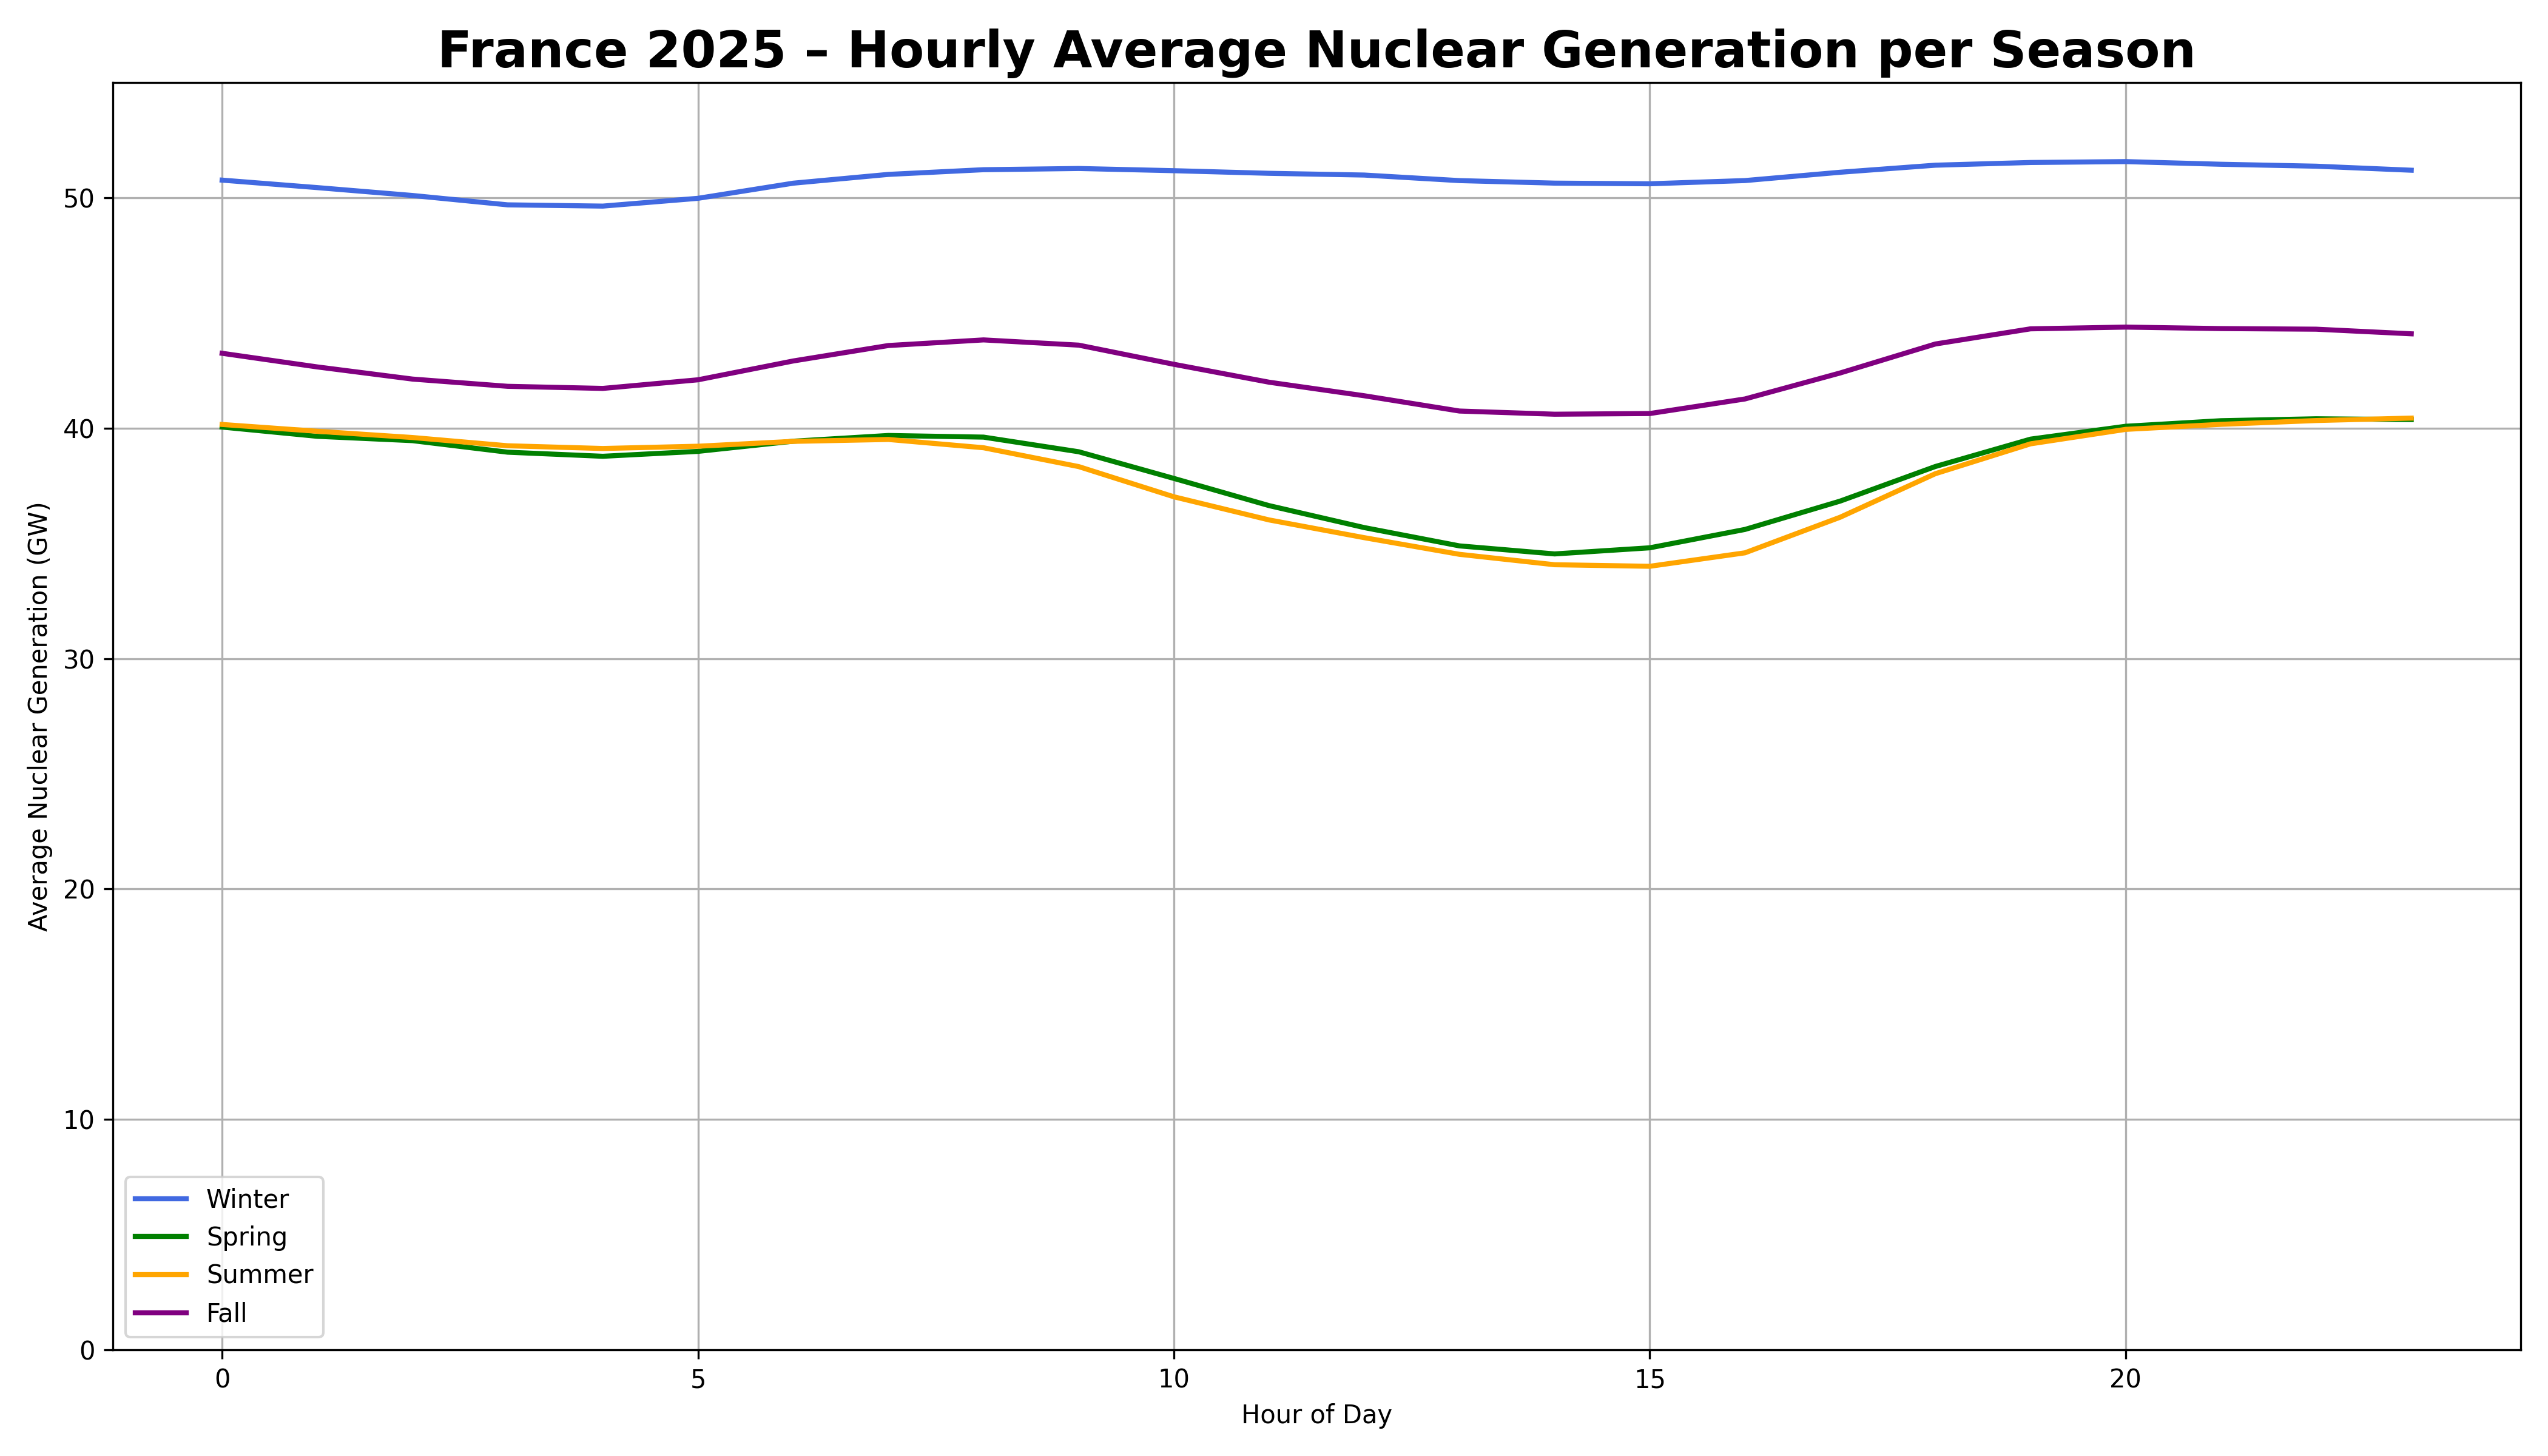
We can also look at average hourly nuclear generation by season. While the data clearly shows that modulation occurs, its impact appears much more modest when viewed through seasonal averages. Here is the EDF report on modulation in case you have missed it.
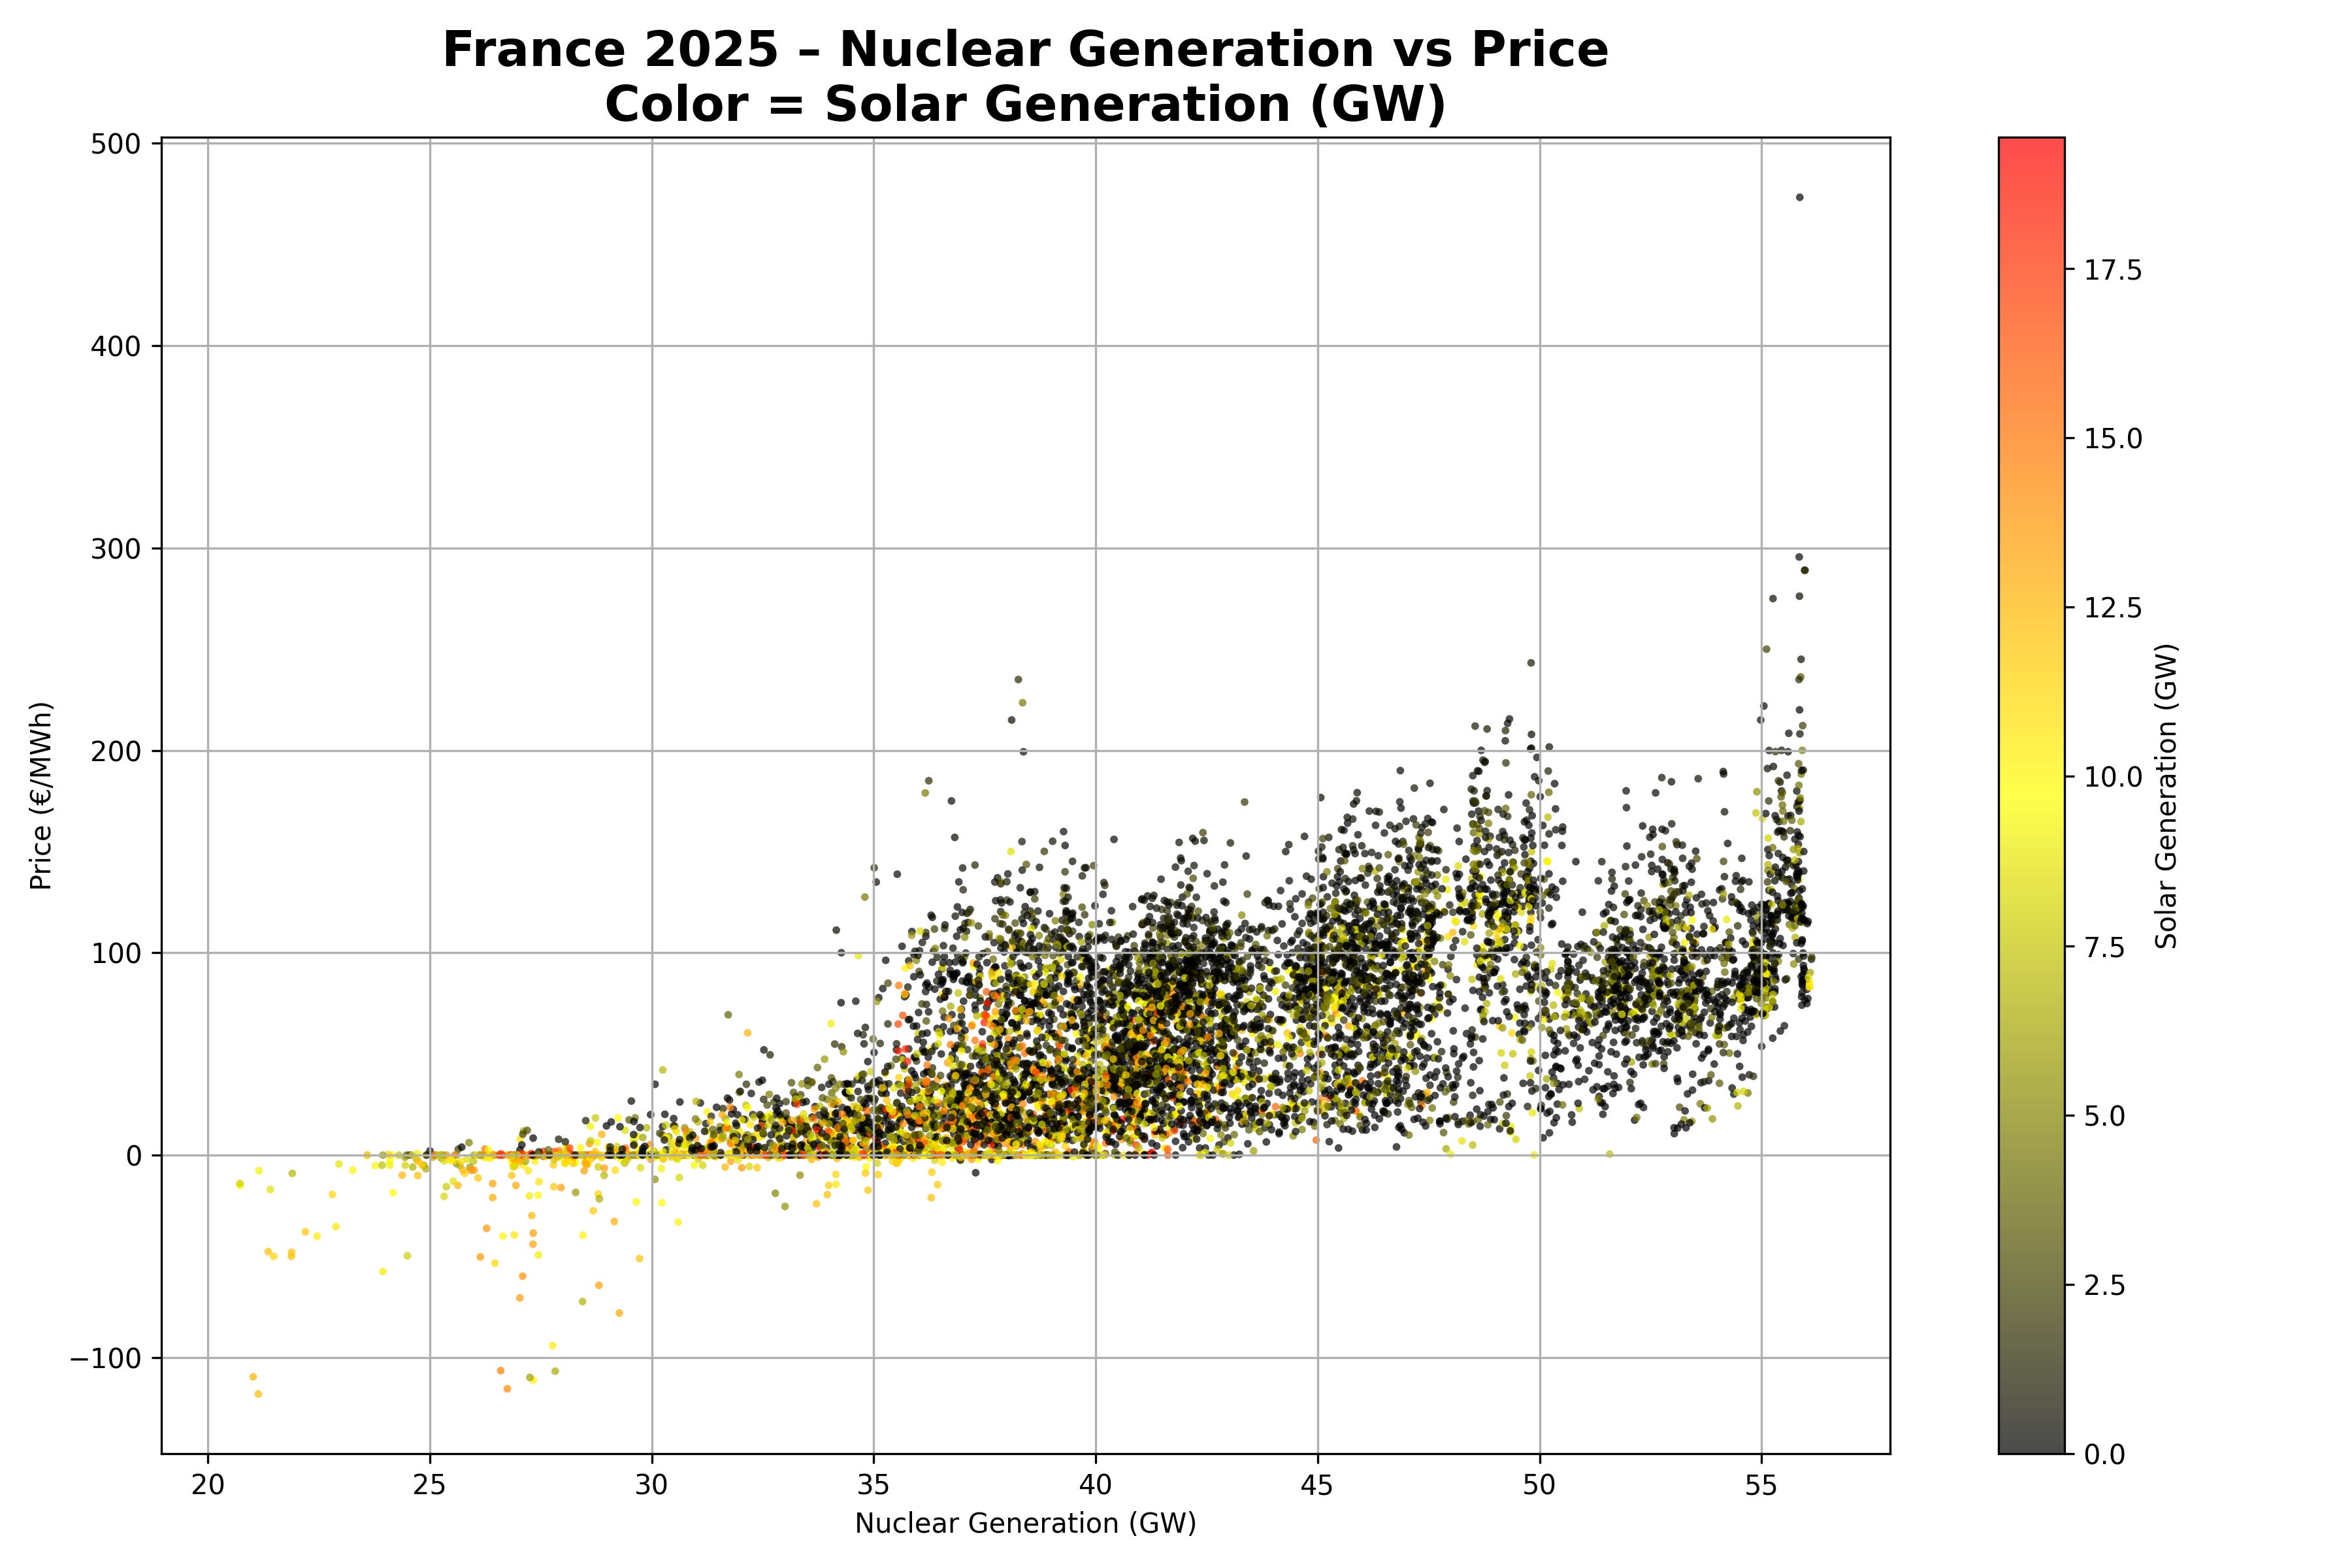
Finally, we examine the relationship between nuclear generation and day‑ahead prices using a scatter plot. The y‑axis shows the hourly average day‑ahead price in France, while the x‑axis represents nuclear output. The points are color‑coded by solar generation to indicate the level of solar production at each interval. As expected, nuclear output is reduced primarily during low‑price periods—precisely those hours that coincide with high solar generation.
After the paywall, I will present detailed data on solar and wind generation in France for 2025, explore a bit forward price projections, examine the rise of negative prices, and discuss several aspects of balancing operations in the French power system.