Solar energy has undergone a remarkable surge in growth over the past few years. In this article, we will delve into the primary advancements that have taken place.
Historical growth
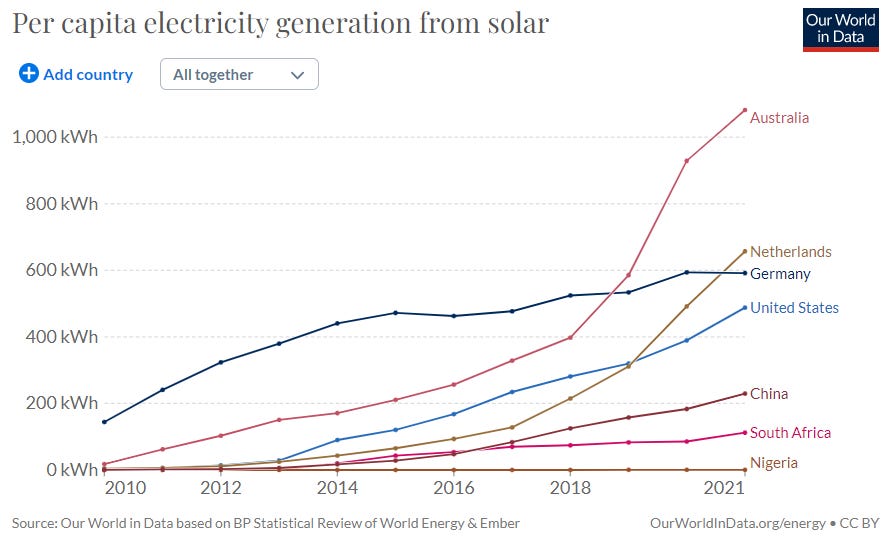
Solar power has exhibited a rapid global ascent in the past decade. Traditionally, Germany held the forefront compared to other major economies; however, the landscape has shifted. Presently, China has taken a commanding lead in installed capacity, with the disparity expected to widen in the coming years.
However, in terms of electricity generated per capita, China still finds itself trailing. The frontrunners in this aspect include Australia (renowned for its solar potential), select Western European nations like Germany and the Netherlands, along with the United States. Regrettably, the largest economy in Sub-Saharan Africa, Nigeria, has harnessed virtually negligible solar energy output.
Interestingly, solar is growing faster, in terms of energy produced, than wind and nuclear after reaching the scale of the exajoule1 in 2016, and this trend is set to accelerate further.

Increased investments
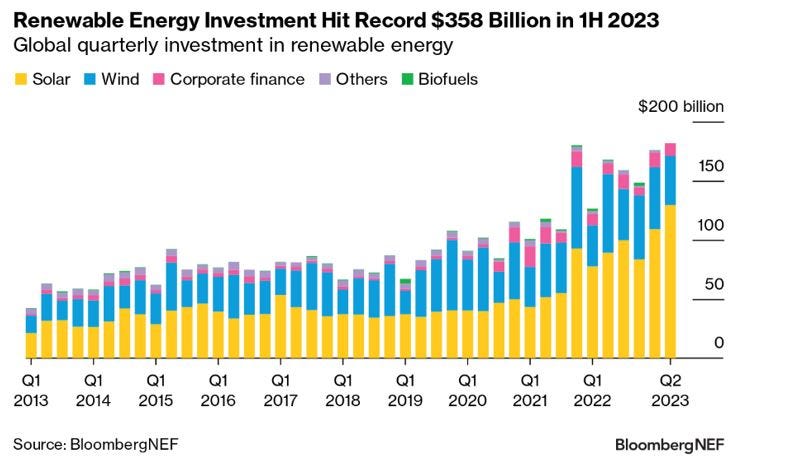
The level of investment in solar energy is unparalleled. During the initial half of 2023, cumulative investments in renewables, as documented by BloombergNEF, surged to a staggering $358 billion, of which an impressive two-thirds—equivalent to $239 billion—was dedicated solely to solar power.
Global prospect for installation
Over the next several years, a dramatic surge in the global pace of solar installations is anticipated, reaching exponential proportions2:
Global solar capacity doubled in 3 years from 2018, bringing the world’s solar fleet to one Terawatt capacity in April 2022. The global solar market is growing exponentially. It took around a decade for world-wide solar capacity to reach 1 TW, from 100 GW in 2012. In just 3 years, SolarPower Europe predicts global solar to more than double to 2.3 TW in 2025.
Solar Cost declines
The prevailing upswing in solar energy can primarily be attributed to the steep reduction in solar costs within a mere decade, particularly in relative comparison to the energy crisis of 2021/2022. From the 2023 Lazard report on LCOE:
Even in the face of inflation and supply chain challenges, the LCOE of best-in-class onshore wind and utility-scale solar has declined at the low-end of our cost range, the reasons for which could catalyze ongoing consolidation across the sector—although the average LCOE has increased for the first time in the history of our studies.
Even though the average LCOE3 for solar has increased recently due to the high worldwide inflation, the cost of solar projects is still expected to decrease as explained in this post.
Focus on Europe
Imports of solar modules are at an unprecedented level. In Q1 2023, 29.5 GW of modules has been imported from China to Europe. This is an increase from the 86.6 GW imported in 2022 (56% of China’s total export volume), which was already a substantial increase on 2021’s 40.9 GW. Rystad Energy is forecasting that Chinese imports will reach 120 GW in 2023. It should be noted that the EU + Norway has a capacity of 9.2 GW for the manufacturing of solar modules.
This magnitude of imports finds its parallel in the present extent of installations across Europe. Throughout 2022, the 27 EU nations established a fresh solar capacity of 41.4 GW, marking a remarkable 47% surge compared to the preceding year.
Anticipations from SolarPower Europe indicate projections of 50 GW installations for 2023, further escalating to an impressive 85 GW by 2026., leading to a total of 229 GW of solar capacity to be installed in four years. This is more capacity than the currently installed capacity of 209 GW (end of 2022). The feasibility of achieving such an installation rate seems well-founded, particularly when considering the substantial influx of imports from China.
SolarPower Europe expects the trend to continue further until 2030:
What is more striking is that the 920 GW total market size in our new Medium Scenario 2030 has improved so much that it now overshoots the EU Commission’s REPowerEU strategy’s 750 GW solar target by 170 GW; the previous 2030 projection was expecting 672 GW in 2030
This market size of 920 GW can be compared to the average generation in the EU of 318 GW4. Such a solar capacity would be almost three times higher than the current electricity demand. Demand flexibility and storage would be key to absorbing such a solar generation.
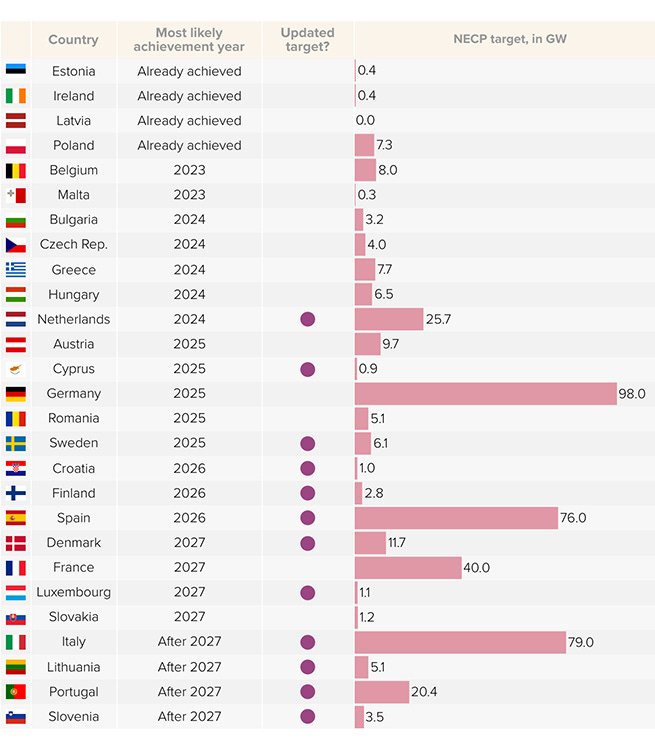
Within this context, it comes as no surprise to witness the attainment of 2030 solar targets in the majority of the NECP5 well in advance of their stipulated deadlines.
Everywhere except Sub-Saharan Africa
An anomaly amidst the global surge in solar adoption can be observed in Sub-Saharan Africa (SSA). The underlying causes are elucidated here. Excluding South Africa, SSA possesses a mere 2 GW of solar capacity, translating to a meager 2 watts per capita, which is 500 times less than the solar capacity of the Netherlands.
Will the exponential growth continue?
Is the sustainability of such growth viable in the long term? Are there any constraints on the capacity of installed solar systems? Presented below are several potential limitations for consideration in the long run (not an exhaustive list):
The declining value of solar energy. As described in a previous post, the value of solar energy is decreasing when its penetration in a given grid is increasing. If the captured value of solar generation is getting too low, it might put an end to an ever-increasing penetration. This could be countered by an increased use of storage and flexibility.
Transmission grid constraints. It is becoming increasingly clear that the physical transmission of electrons from renewables is constrained by the current grid capacity.
Over-reliance on a single country. China is by far the most important player in the manufacturing of solar technology6. We might tend to reduce our imports from China, leading to potentially higher prices and supply challenges.
The cost of capital has increased, rendering new renewable projects less attractive.
Might any of these constraints truly impede solar development? If so, when could this occur? Predicting the future is a challenge, yet given the current surge in solar manufacturing capacity, optimism seems warranted for the promising trajectory of solar advancement.
An exajoule is equal to 277.8 TWh, or slightly less than the electricity consumption of Italy.
From SolarPower.
As explained in a previous post, we should also be careful when using LCOE for comparing various technologies.
Total electricity production was 2785 TWh in 2021, divided by 8760 hours in a year, it is an average generation of 318 GW.
NECP stands for National Energy and Climate Plans.


