The solar cannibalization effect
An important phenomenon that is impacting greatly the fastest growing renewable technology
This post was also summarized on my Twitter feed.
The rise of solar in the EU
Solar energy is rapidly expanding around the world thanks to the significant decrease in PV prices as well as the increase in fossil fuel prices. In Europe, solar is booming as the expectations are now higher than the most recent EU plan. According to energy-charts, with an installed capacity of 162 GW installed in 2022, the EU countries generated 167 TWh, equivalent to a capacity factor of 11.8%. This solar generation was responsible for 6.64% of the total load (2516 TWh in 2022).
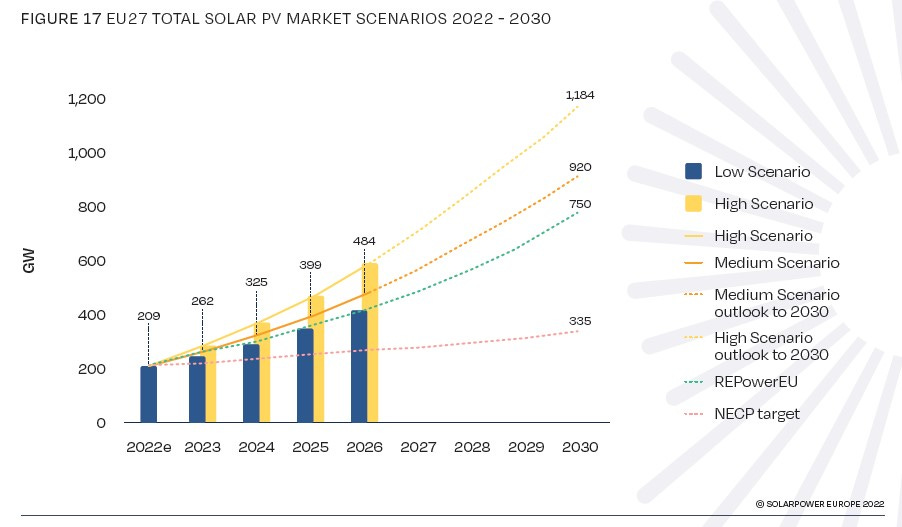
The outlook for solar is extremely bright. In the Medium Scenario of the EU Market Outlook for Solar Power 2022-2026, the installed capacity in 2026 would reach 484 GW installed and 920 GW by 2030. With a similar capacity factor of 11.8%, that would result in a generation of 500 TWh and 951 TWh for 2026 and 2030 respectively. With a total electricity load increasing by 3% per year, the solar market share would be 17.7% and 29.8% for 2026 and 2030 respectively. In addition, REPowerEU is targeting 750 GW by 2030 in the EU.
Captured prices and cannibalization
Intermittent renewables such as solar and wind have a very low marginal cost impacting notably the curve of electricity prices. The residual load, i.e. the load minus wind and solar generation, is a good indicator of the power prices. Hereunder is an example of the day-ahead prices compared to the residual load for 2023. Unsurprisingly, the prices are correlated with the residual load and we can also observe an even greater price decrease when the residual load is lower than 20 GW approximatively, suggesting a non-linear effect.
Due to this effect, the captured prices by renewables are decreasing with their market penetration. The captured price is the expected price of electricity sale for a generation unit, in other words, the average market price weighted by the generation profile of the resource. This captured price for high penetration of renewables is likely to be lower than the average market price because solar and wind would produce more when prices are lower. This effect is also called cannibalization.
Concentration of solar
The cannibalization effect for solar is more pronounced as the capacity factor for solar is much lower than wind, a direct consequence of the fact that solar energy is concentrated in relatively fewer hours. Hereunder is the energy delivered for a PV plant in Spain as a function of the utilization rate. It means that the hours when the solar plant is producing less than 50% of its nameplate capacity are only contributing to 24% of the total energy delivered1. Of course, this result is site-specific.

Let’s now consider the year 2027, right after 484 GW has been installed in the EU. With a utilization factor of 50%, the total solar generation in the EU would be 242 GW covering around three-quarters of the instantaneous load. By adding the other generation with very low marginal costs such as nuclear, wind, and run-of-river, we can expect that the residual load would be minimal, leading to market prices close to zero, or even negative. This happens repeatedly already in April and May 2023.

As a very simple rule of thumb, let’s assume that the market price is zero as soon as the utilization factor is above 50%. Only 24% of the energy will have a price above zero, meaning that achieving an average price of 50 EUR/MWh would only be possible if this 24% is valued at more than 208 EUR/MWh. Evidently, this is a simplistic calculation but it gives an idea of the magnitude of the challenge as we are set to increase drastically the installed solar capacity.
Local disparity
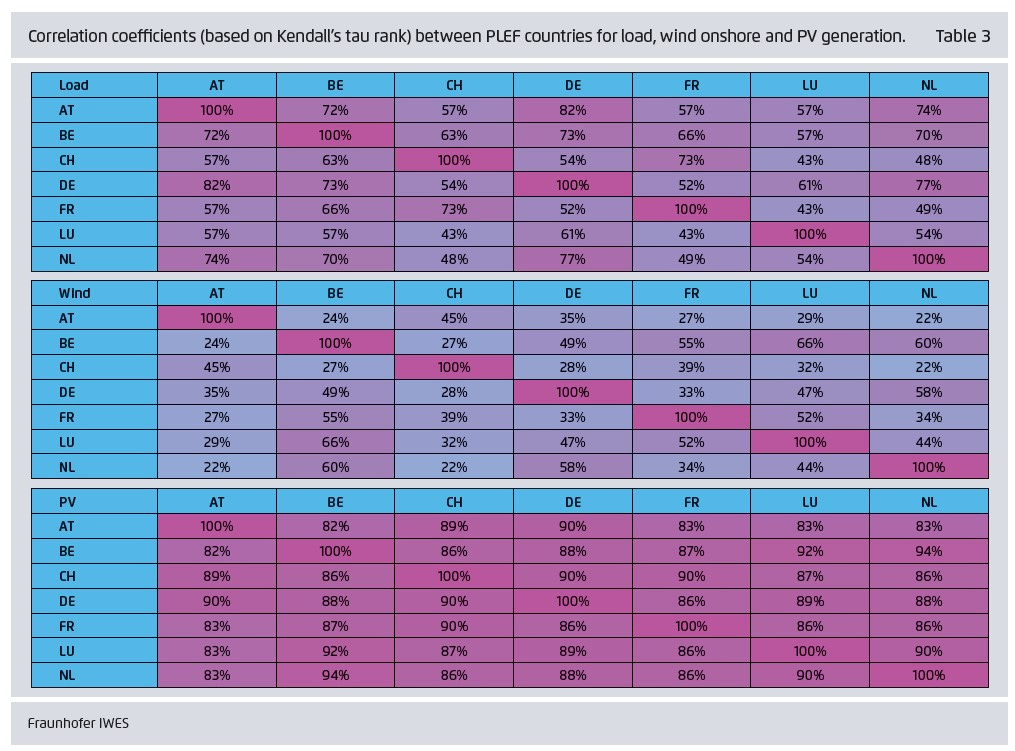
Of course, there exists some geographical dispersion that might reduce the cannibalization effect locally. Nevertheless, solar generation tends to be highly correlated between countries, much more than wind generation.
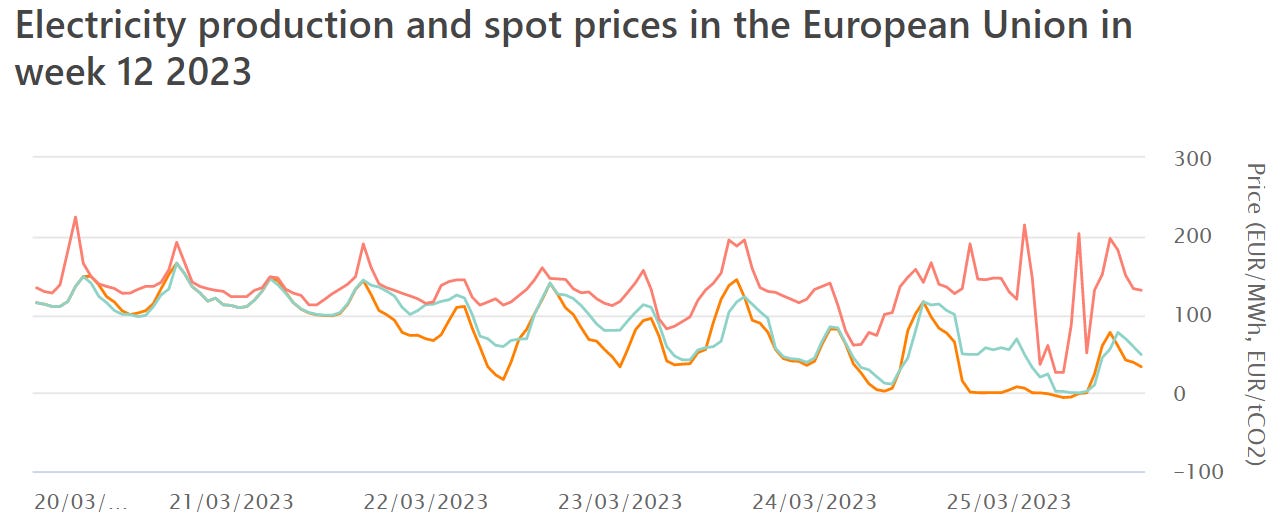
In addition, the transmission grid is a major bottleneck to the harmonization of prices and we might observe a larger cannibalization effect in some parts of the European grid. For example, the graph below shows the day-ahead market price for Germany (orange), Spain (blue), and Greece (pink). We are observing that for the 20 and 21 March 2023, prices were relatively similar but the following days, they were quite different, indicating congestion in interconnections. For example, on March 25 at 3 PM, prices were respectively -0.87, 0, and 203.17 EUR/MWh in Germany, Spain, and Greece respectively.
The consequence for PPA - CfD
Developers of utility-scale solar projects are looking for long-term contracts to sell their energy. Ideally, they are looking for a fixed price or at least a deal with a floor price. Indeed, projects would be hard to finance if the price risk is high and uncertain. Developers and potential buyers of renewable energy should be aware of the cannibalization effect when they are negotiating their PPA. With the current expectation on installed capacity within Europe, it is likely that the captured price would rapidly decline, potentially below the Levelized Cost of Electricity (LCOE).
Similarly, the EU has recently pushed for the adoption of Contract-for-Difference (CfD). With this scheme, the sale price of the renewable source is guaranteed because the difference between the market price and an agreed strike price, either positive or negative, is transferred to the renewable generator. This scheme is presented as a way to ensure a revenue for the State and therefore, a potential protection of consumers against high prices. This is of course only true as long as the captured price is above the agreed strike price, which is likely to be related to the LCOE. With the rapid increase in solar capacity, this assumption is becoming unlikely in the second part of this decade. We developed this theme in two other posts (1,2).
A potential way out
The introduction of large-scale flexibility solutions would counterbalance the low captured price by renewables, solar in particular. Such flexibility solutions include vehicle-to-grid, hydrogen production, and thermal storage amongst others. Nevertheless, these solutions are only relevant if the spread between low and high prices is sufficiently high and if we have the proper regulations (dynamic tariffs, etc.) and the infrastructure (smart meters) in place. But are we going fast enough with regulations and infrastructure to enable the use of this abundant renewable energy? This is far from clear.
It means that 76% of the energy is delivered when the power plant is higher than 50% of the installed capacity.


Very interesting article, thanks for sharing. Just one little comment: it would be great if you could link to the sources of the tables and figures you cited (if you haven't created yourself), so that the reader has an easier time to continue exploring.