Have you heard of dunkelflaute? I assume you have if you're reading my Substack. The definition from Wikipedia: In the renewable energy sector, a dunkelflaute (lit. 'dark doldrums' or 'dark wind lull') is a period of time in which little or no energy can be generated with wind and solar power, because there is neither wind nor sunlight. In meteorology, this is known as anticyclonic gloom.
These periods occur from time to time in winter, and during these moments, electricity prices often increase significantly. We typically refer to the day-ahead market since it is the cornerstone of electricity trading. However, it's also interesting to look beyond and understand what can happen in other, albeit smaller, parts of the electricity ecosystem. Let's start.
A day with high prices
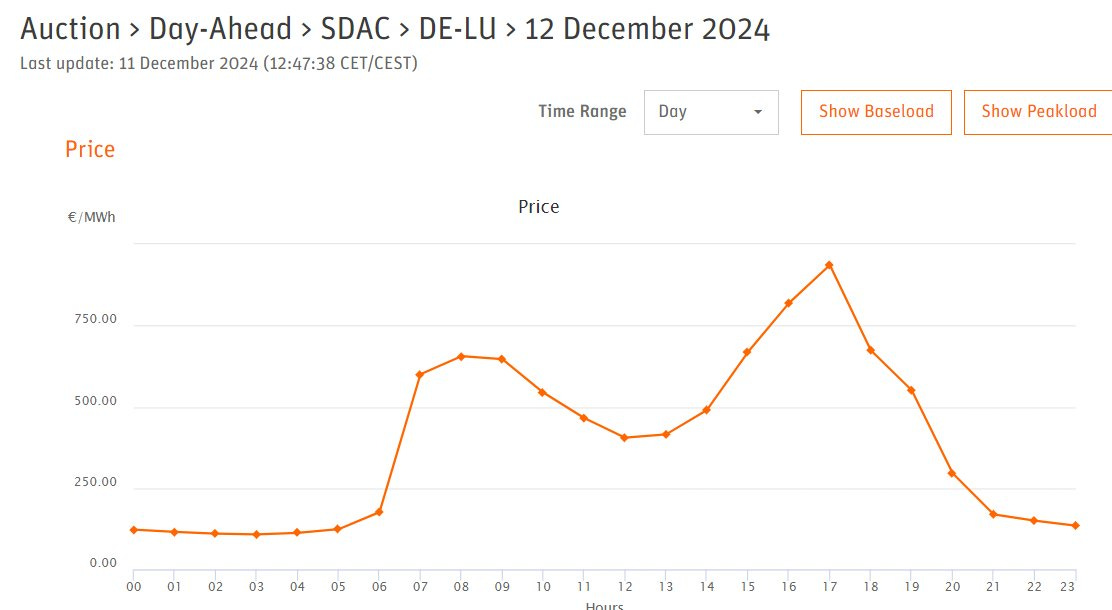
One month ago, on December 12th, a small dunkelflaute situation occurred, with prices reaching 936 €/MWh on the day-ahead market in Germany at 5 PM. This is more than 10 times the typical price level in winter.
Looking across the entire continent, we see that Germany was not alone, as several countries experienced daily average prices exceeding 300 €/MWh.
These prices generally coincide with periods of high residual load1, which is generally a combination of high demand and low generation output from renewables.
These days are relatively rare
Even if these price levels are impressive, we should not exaggerate their impact as there are not occurring that often. Hereunder is the brillant analysis from Gabriele Martinelli. Part of his analysis here:
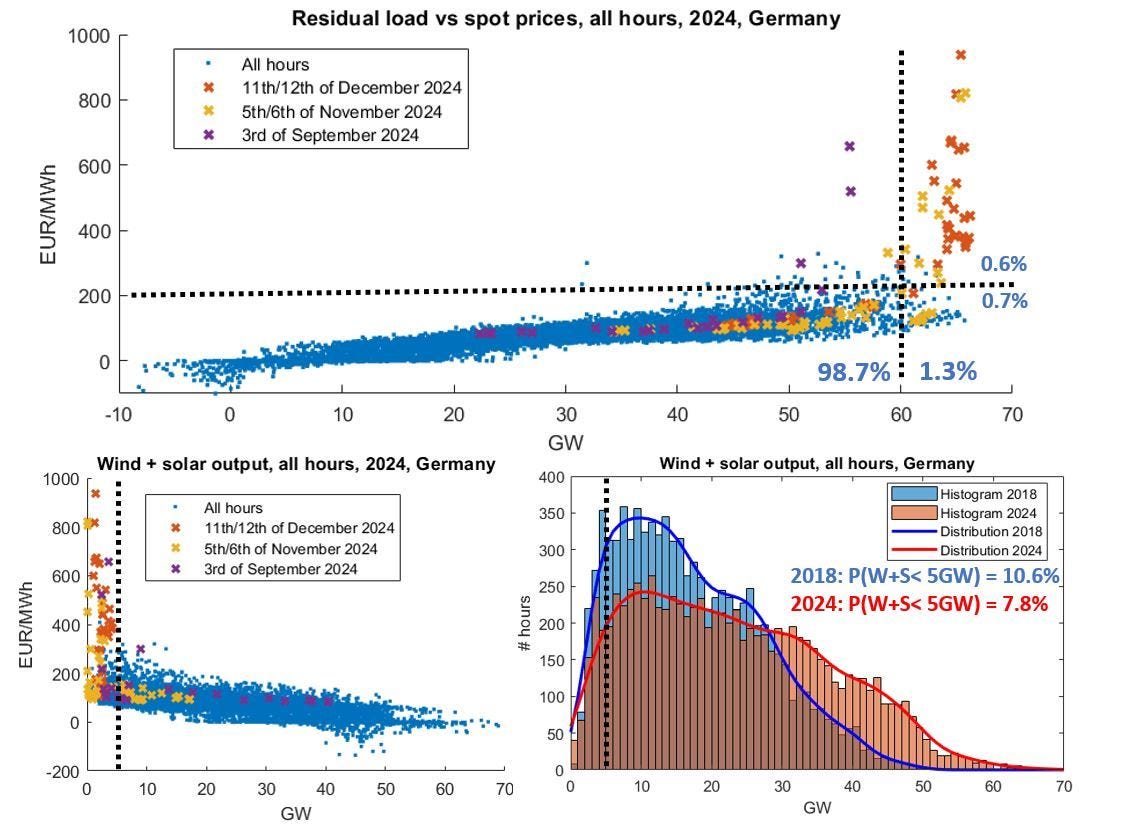
When we analyze residual demand vs spot prices, we see immediately that the curve is very well behaving, almost linearly, until residual demand reaches roughly 60GW, which corresponded to 98.7% of all 2024 hours! All the famous spikes in 2024 are concentrated in just 5 days (to be precise, in a small amount of hours distributed in those 5 days).
What caused these spikes ? We all know the answer, low wind and solar output. However there is not a 1-to-1correlation between low intermittent renewable generation and high prices. If we set a symbolic threshold of 5GW, the number of hours with RES below 5GW in Germany was 7.8% in 2024, however only in less than 10% of these hours (or 0.6% of the total) we observed spikes! In the vast majority of hours with low renewable output the European power markets found solutions (hydro and BESS storage, interconnections,...) to mitigate the impact.
How is the probability of these spikes evolving over time? If we consider the same symbolic threshold of 5GW, the likelihood of wind+solar below that has decreased by 30% in 6 years, from 10.6% in 2018 to 7.8% in 2024. On the other side, the lack of baseload is pushing in the other direction, making the system even more "dependent" on a good renewable output, and "raising" that threshold. The development of storage and flexibility plays a crucial role in this delicate balance.
The visual from his post below illustrates the linear relationship between residual load and the hourly day-ahead price, except in cases of very high residual loads (shown in the graph above) and very low renewable output (bottom left).
Is it only the day-ahead market that is impacted by high prices in such situations? The obvious answer is no, and I'll show why below.
Amplification of high prices in intraday continuous auctions and imbalance price on 11 December 2024
The graph below displays the German day-ahead prices alongside indicators for the continuous intraday auctions. The continuous intraday auction is a marketplace where sellers and bidders exchange energy on a continual basis, unlike the day-ahead market and intraday auctions, where all bids are cleared simultaneously at a specific time2.
Dark orange: The average intraday price, representing the average of all trades concluded across all timeframes before delivery. Light orange: ID3, the weighted average price of all continuous trades executed within the last 3 trading hours of a contract. Yellow: ID1, the weighted average price of all continuous trades executed within the last trading hour of a contract.
As we can see for December 11 (green rectangle - the curves peaking at 2000 €/MWh), the continuous intraday prices were significantly higher than the already elevated day-ahead prices. Additionally, the intraday index closer to delivery (ID1) is higher than ID3, indicating that bids were increasing as delivery time approached. This suggests that the "already stretched system" was becoming even more stressed at that moment. The exact reasons for this are not entirely clear to me, though one possibility could be underperformance of wind energy3.
We can also observe this stressed situation reflected in the imbalance price. As shown below, the imbalance price remained very high for several hours, peaking above 4000 €/MWh at certain moments. This demonstrates the interdependence between different time horizons in the electricity markets.
A different situation on 12 December
In contrast to the situation on December 11, the prices in the intraday market were not as critical on December 12 when the day-ahead price reached its highest level of the year (see the blue rectangle on the earlier graph). This likely implies that more resources were available as anticipated since the intraday prices settled at a much lower level.
Furthermore, we can observe that the imbalance price was comparatively very low at the time of the peak day-ahead prices (which occurred in the evening), except in the morning, when, the system was still under stressed, as evidenced by the high imbalance prices, as well as the higher intraday prices compared to the day-ahead price.
Going to balancing markets: aFRR merit order
Not only did the intraday markets and imbalance prices show signs of scarcity, but the less-known balancing markets did as well. Balancing markets are essential to ensure that grid operators have sufficient means to safely operate the grid. There are various markets and products within these categories, each with its own characteristics. Generally, there are two main payments: one for the activation of reserves (or an energy price) and one for the reservation of capacity. Let's start by looking at the energy component of probably the most important one in Germany: the aFRR.4
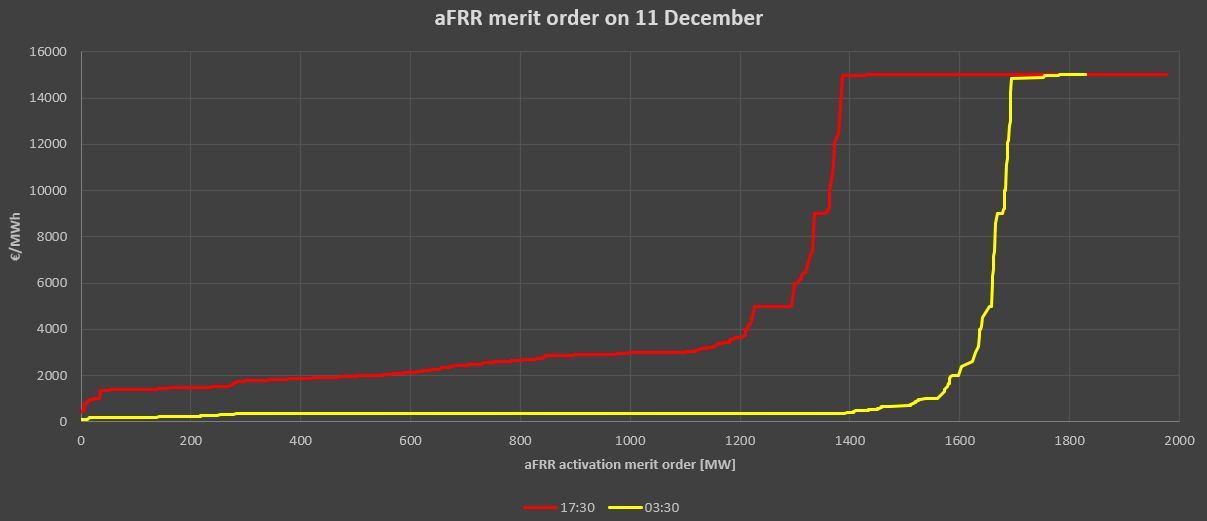
Below are the aFRR curves for two different quarter-hours5 on December 11 in Germany: red represents peak time at 5:30 PM, and yellow represents night time at 3:30 AM. We can observe that the merit order at peak time was significantly higher than during the night. Practically, TSOs would activate 400 MW of aFRR at 2000 €/MWh during peak time, whereas for the same price at night, they would activate around 1600 MW of aFRR—four times more.
aFRR and mFRR capacity prices
In addition to the energy prices for power reserves, there are also payments for the capacity of these reserves. Every day, there is an auction to ensure sufficient capacity will be available for the next day, maintaining an adequate level of power reserves to ensure stable grid operation6.
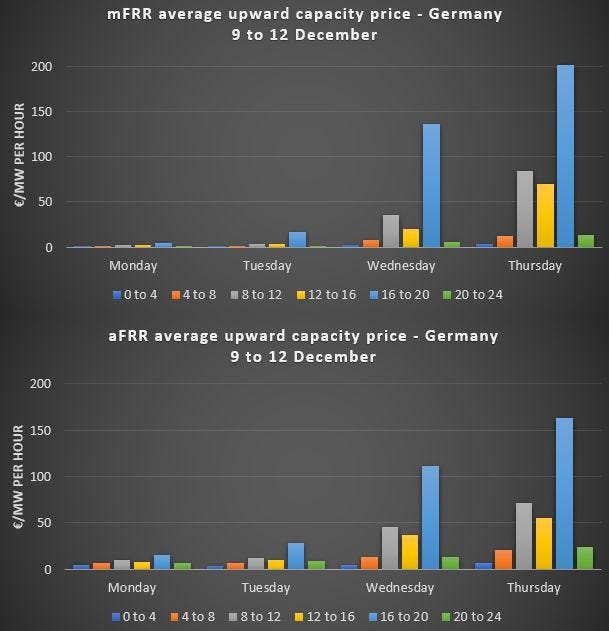
Generally, the prices for such capacity are limited when the provision of reserves is a "byproduct" of energy production. If a power plant is not operating at full capacity, the remaining capacity can be offered cheaply for power reserves. However, when generation capacity becomes scarce, such as during a dunkelflaute period, we observe a sharp increase in capacity prices. Below are the capacity prices for four days, including the last two days when the system was stressed.
We can observe that capacity prices dramatically increased from almost nothing on Monday, December 9, especially for mFRR, to prices reaching 200 €/MW per hour on Thursday, December 12.
Interestingly, the auctions for balancing capacity take place before the day-ahead market auctions. Therefore, the results of the balancing capacity auctions can serve as a relatively good indicator of potential higher prices in the day-ahead market.
In a nutshell
Dunkelflaute periods will continue to occur occasionally during winter in Europe. Typically, commentators focus on the impact these periods have on day-ahead prices, which is reasonable since the day-ahead market is the cornerstone of our electricity markets. However, the impact is also felt in other segments of the electricity markets, notably the intraday markets and the balancing markets, affecting both energy and capacity prices.
For more insights on these topics, you can check some of my earlier posts here:
Thanks for reading,
Julien
The residual load is defined as the load minus the generation from wind and solar.
See the forecast levels of wind for Germany: actual generation was about half of the day-ahead forecasted generation.
aFRR means automatic Frequency Restoration Reserve.
The market is organized per quarter-hour.


Another fine article. However, picking up on a point:
“What caused these spikes ? We all know the answer, low wind and solar output”
Is this a correct formulation for the question? May I suggest the following:
What triggered the spike in prices? Answer: The anticipation by the market that there would be low wind and solar output. Thus, the MARKET caused the price spike. I’d also observe that massive profits would have been made by those companies selling probably mostly fossil-based elec into the market. This then starts to raise questions about “social welfare” – a phrase often used by proponents of markets to justify current “arrangements”. Lastly the opposite of a Dunkelflaute occurs spring through to autumn when prices collapse – illustrating, in a different way, that elec’ “markets” are wholly unsuited for more & more renewables. Sadly, no serious sign of reform is on the horizon – just “deckchair rearranging” on the sinking elec market ship.
'Interestingly, the auctions for balancing capacity take place before the day-ahead market auctions.'
The results of those auctions for balancing capacity, are they published on ENTSOE? if so, is it in 'Procured Capacity' [GL EB 12.3.F] or 'Volumes and Prices of Contracted Reserves' [17.1.B&C] or both?