


Daily spreads on the day-ahead markets
And the link with batteries

One aspect that is becoming increasingly important in the electricity markets is the daily spread —the difference in valuation of electricity from one hour to another within the day. Historically, this spread was minimal, leading to mostly flat prices throughout the day (after all, why should we consider time-varying tariffs when electricity prices remain constant?). However, the recent energy crisis as well as the rise in solar energy have significantly widened this spread, even in the most liquid market, the day-ahead market.
In parallel, we are observing a large increase of batteries into our grids, driven largely by a drop in installation costs. These two trends are leading to the question: are the spreads getting substantial enough to potentially make battery storage systems profitable in the day-ahead market? This post is all about that, so let’s chase the spread together.
What is the spread?
In this post, we define the daily spread as the difference between the highest and lowest prices that occur within a single day on the day-ahead market. It reflects extremes on both ends—potentially large negative prices on the lower end1, and price spikes on the higher end during periods of high demand and low renewable energy availability2.
Chasing the spread
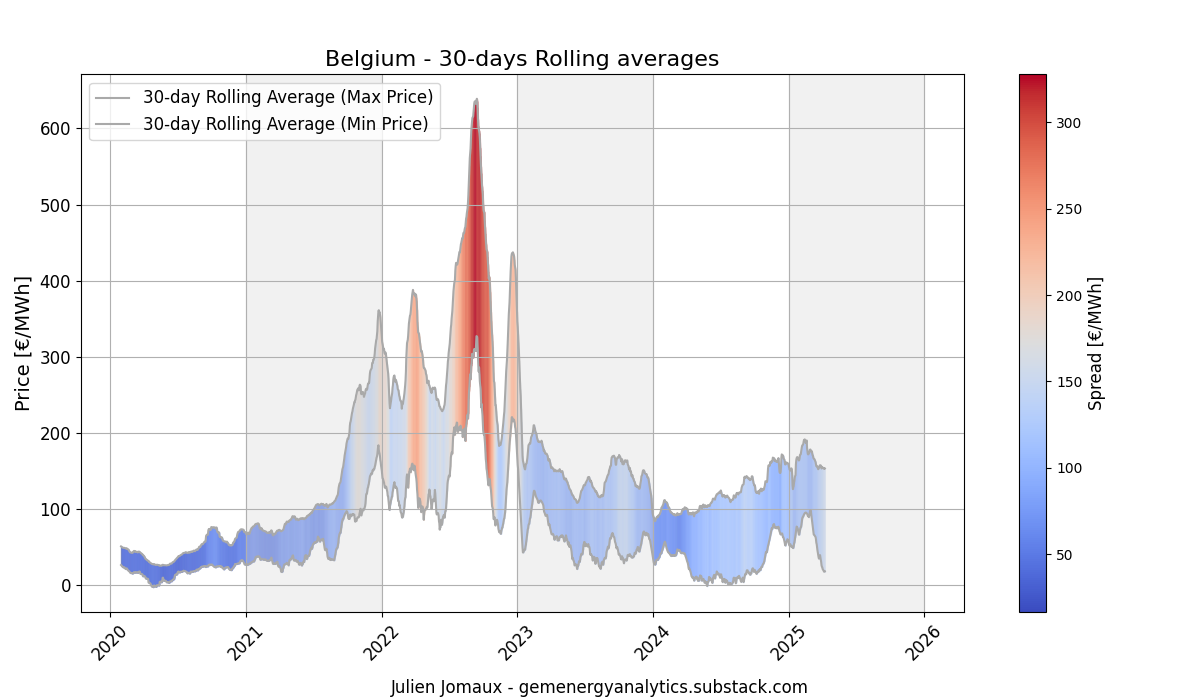
After defining the spread, let’s review what happened in four countries: Germany, Belgium, Poland, and Hungary. The graphs below present the rolling average of the daily spreads from 2019 or 2020 until today (April 2025), with the color coding within the rolling average of the maximal and minimal prices. I use rolling averages in order for the graph to be understandable and as I am interested primarily to the trend (not to particular extreme days).
Germany and Belgium
Let’s start with the two countries sharing the same flag colors. Both countries have a relatively similar dynamics. We can note the following:
Very limited spread before the energy crisis.
The energy crisis has created some very high spreads, mainly exacerbated by a general elevation of all power prices. Indeed, the minimal price was higher than 300 €/MWh (rolling average).
A period of relatively high spread, reaching levels above 100 €/MWh, with minimal prices being very low (=solar penetration) except in winter, and maximal prices reaching the 200 €/MWh level.
Belgium has slightly lower spreads than Germany.

Poland and Hungary
The story is relatively similar for Poland and Hungary until the energy crisis.
Poland was a champion of low spread before the crisis and the country is now having spreads higher than 200 €/MWh (rolling average basis), which is higher than its neighbor Germany.
Hungary is facing even higher spreads recently than during the energy crisis. Maximal prices are skyrocketing, while minimal prices are being kept low, thanks to solar.


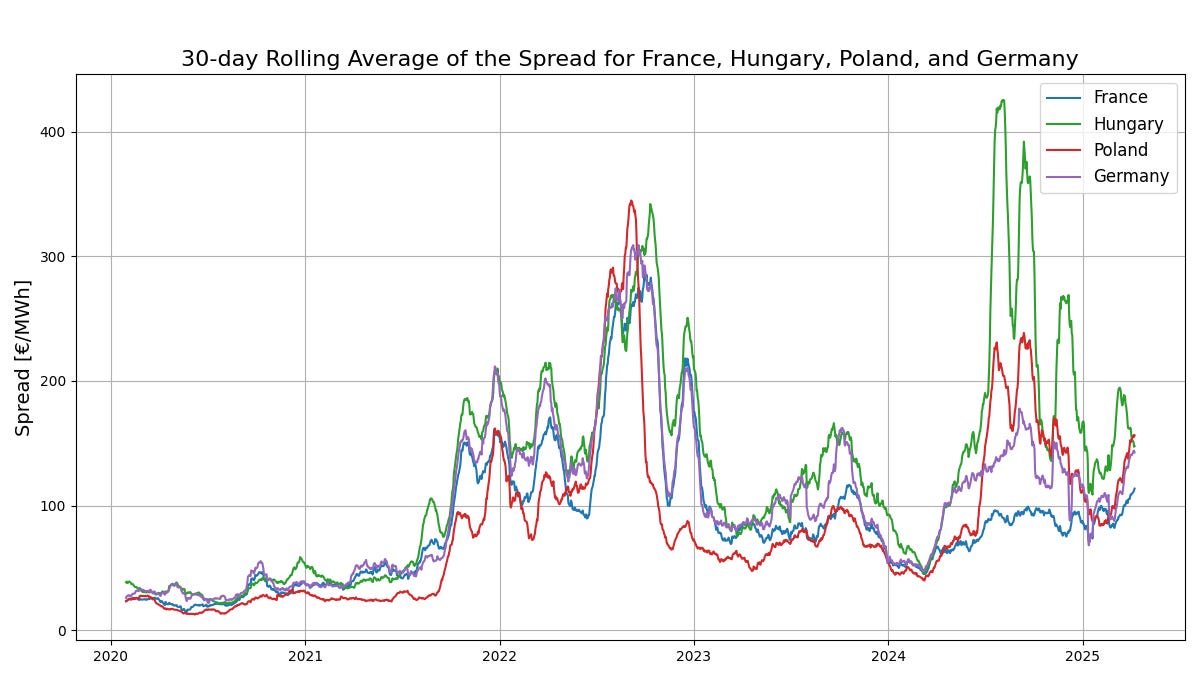
All together
Here is a closer look when all countries are put together on the same graph. We can see the extreme spreads in Hungary compared to France recently.
What about more than one-hour spread?
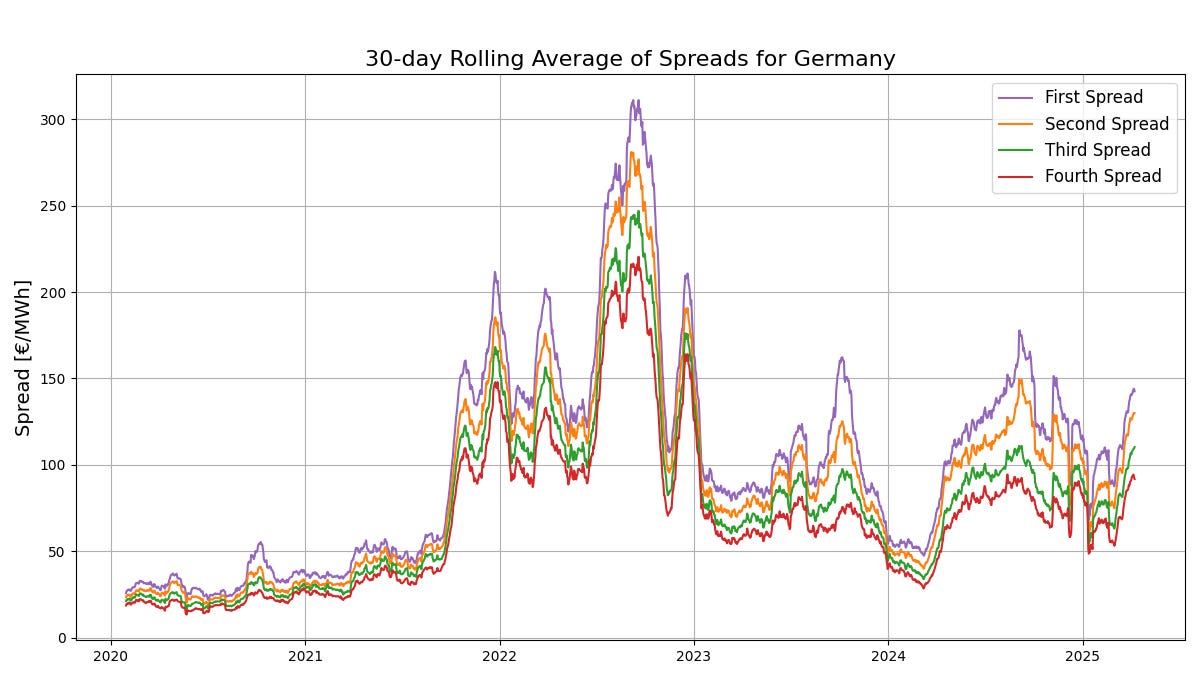
The spread, as defined earlier, represents the difference between the highest and lowest values of daily results. Clearly, a battery with the capacity to store only an hour's worth of energy would face constraints. Therefore, it's valuable to examine spreads at lower levels as well. The second spread is defined as the difference between the second highest and second lowest prices of the day. Below is a graph illustrating the rolling averages of these spreads in Germany.
In 2024, the second-level spread was not markedly different from the primary spread. However, as we move to the third and fourth level spreads, the disparity becomes notably smaller, seldom exceeding 100 €/MWh.
What about the intraday market?
The intraday markets operate in two ways: firstly, through an auction-style market, similar to the day-ahead auction but with gate closures that are closer to real-time. However, liquidity in these intraday markets remains relatively limited. Secondly, there is the continuous intraday market, which functions differently as it operates continuously, as its name suggests. This means that a trade is concluded as soon as a buy bid matches a sell bid. Consequently, there exists a wide range of prices for the same product, and new information can significantly impact price formation in either direction.
Several indicators have been developed to provide insights into pricing: common ones include the average price of all trades for a specific product, and the average price of trades conducted one hour before delivery, known as the ID1-Price Index.
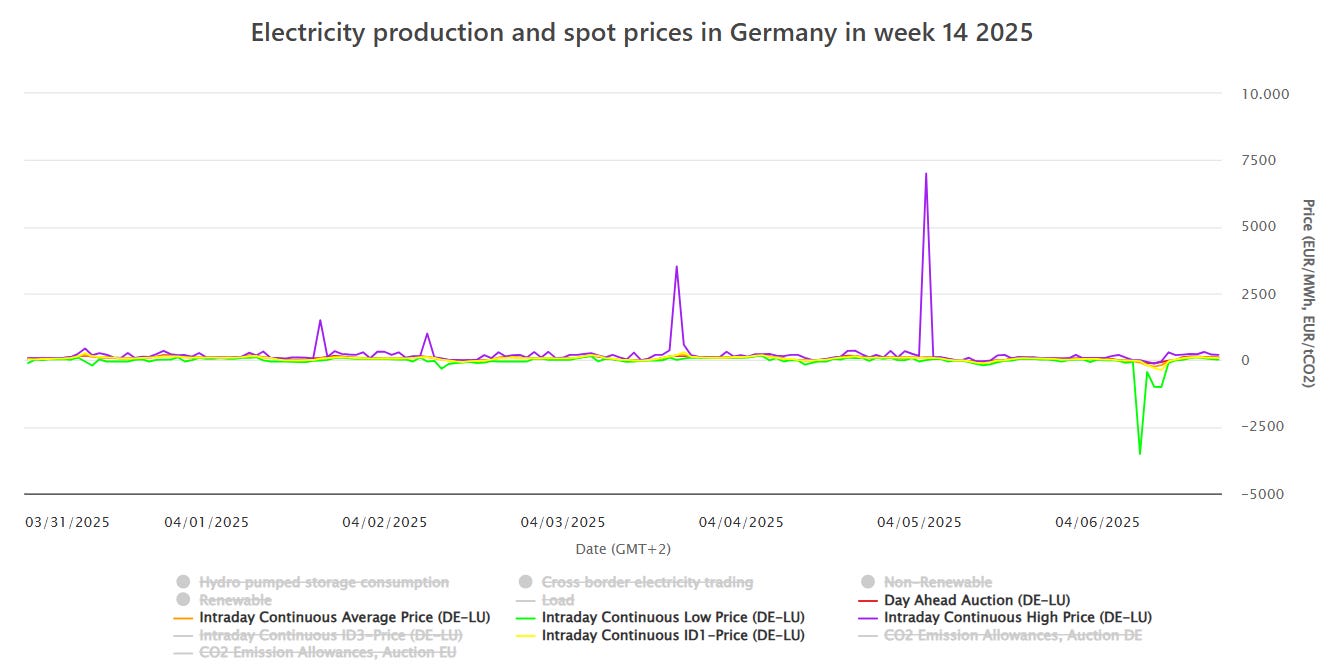
Below is an image from a recent week depicting the day-ahead price, the intraday average price, and the ID1-price index. As observed, these indicators tend to closely follow each other, although some extreme price variations are highlighted. While spreads may occasionally offer better opportunities, they generally adhere to a pattern not far from the day-ahead price.

When examining the same week and including the highest and lowest trades that occurred, we observe some extreme events. This indicates that certain trades could be exceptionally lucrative, though capturing these opportunities is difficult and often a matter of luck. Consequently, these extreme events are not truly representative of typical market opportunities available to all participants.
Can a battery make it? Back-Of-The-Envelope Calculation
I don't aim to provide a precise investment calculation. My intention is simply to share a rough, back-of-the-envelope calculation that, in my view, indicates the general trend.
A Tesla Megapack, a relatively high-end battery storage, is said to be around 10 M$ for 20 MW/40 MWh, installation not included3. This translates to approximately $250 per kWh. Adding 30% for installation expenses and factoring in the exchange rate, the total cost would be approximately €12 million for this battery.
Assuming a return on investment over six years (without financing costs), the project would require €2 million per year to be viable, or about €100,000 per MW for a two-hour battery configuration. Focusing solely on day-ahead arbitrage and completing one full cycle per day, the battery would need to capture a spread of €100,000 divided by 365 days, equating to approximately €274 of daily spread for two hours. This assumes the battery can capture the full spread with 100% availability. As we can see, this target is relatively high compared to current spreads.
Nevertheless, if we assume a battery price half of the presented above, then the required daily spread becomes 137 €. The reality is of course much more complex that what I present here, but the trend is clear: being profitable for batteries using the spreads in the day-ahead markets only is not a distant dream anymore. Indeed, the rolling average of the spreads are getting potentially large enough4, as I have shown above.
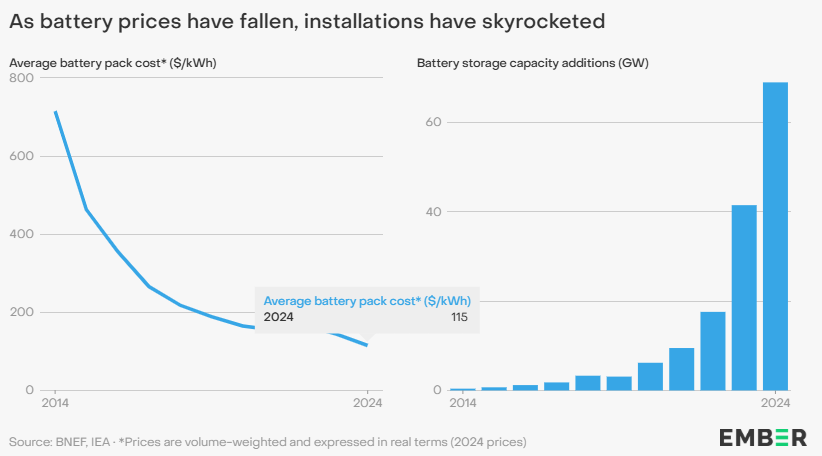
At the same time, battery prices are dropping, as we can see below, with installations skyrocketing. It is said to be already at 115 $/kWh in 2024 (compared to my assumption from the Tesla Megapack of 250 $/kWh).
The importance of the spread and how I view it
Here is my personal opinion. I view the rise of BESS as an important element that will shape our electricity markets. This rise is driven by a simultaneously increase of the business opportunities for BESS (in balancing markets and spreads in intraday markets), as well as a significant cost reduction. Together, these two reasons form currently a very strong business case, which is leading to the massive development of battery projects. This is not so different from the large appetite for solar projects during the peak of the energy crisis, except that the acceleration of new projects, is in my opinion, even larger.
Naturally, these new projects will compete in the most profitable markets first and will gradually transition to markets with lower revenue potential. Ultimately, the day-ahead market will be the key arena, as it is the most liquid market with the highest volume. It is only a matter of time until the potential earnings for a battery in balancing markets and latter on, the intraday markets approach5 the level of remuneration in the day-ahead market. Will this happen before the end of the decade? I do not know, but given the current number of BESS projects underway or in planning, this transition is certainly underway.
This perspective also supports the notion that developing hybrid solar projects6 makes sense. Developers of these projects aim to leverage storage capabilities to shift solar generation to periods with the highest prices7.
The key question that I still wonder is the depth of the day-ahead market. Will there be enough capacity growth to significantly decrease the current spread in day-ahead markets? While this is uncertain (at least to me), it may be sufficient to alleviate the price spikes occasionally seen during high-demand periods.
Thanks for reading.
Julien
See my previous post on negative prices.
See my previous post on Dunkelflaute.
The presented spread shows the maximal value that can be captured but practically, it is unlikely to capture it entirely. Nevertheless, it is potentially also possible to capture more than the spread if the battery is doing more than one cycle a day.
I would say approach because there will always be, I believe, a top-up for balancing and intraday, as it requires more complex operations. That has also some profound consequences on the potentiel revenues for other assets in the balancing markets.
Solar with storage.
Great analysis as always. I agree with the sentiment. I can see most new solar projects being a standard battery sizing to ensure that it’s not exporting during the worst 2 hours capture rate and expanding to worst 4 hours as well. And in winter capturing the wind spread.
Very good description. Thanks for the insight to rapidly evolving markets.