Solar cannibalization: more details
Solar is growing at an unprecedented speed. Would solar cannibalization go as fast?
In a previous post, we presented the solar cannibalization effect, which is the observation that solar tends to capture lower market prices when its penetration is high. You can also see a summary in a thread on Twitter. There is no doubt that this phenomenon exists and has consequences for the producer and the energy buyer (or the support scheme such as contract-for-differences). The question is more: how hard and how fast will solar cannibalization be? Let’s explore.
The basics
Here is a quick overview of the basics to understand the cannibalization effect. You can also consult this previous post.
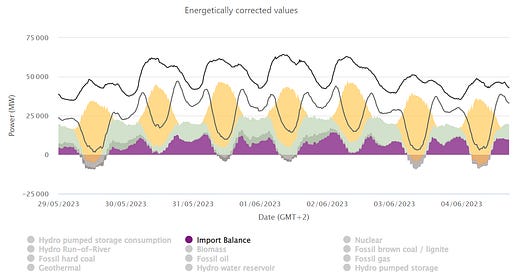
A useful tool to understand the cannibalization effect is the concept of residual load. The residual demand is the demand minus the variable renewables (VRE), i.e. wind and solar. Hereunder we can observe the load, the residual load, the generation from renewables, and the import balance.
When the residual demand is low, prices tend to be lower (see graph below). Also, the import balance turns negative, as the country is seeking to export power instead of importing. Interestingly, it means that the value of exports is also very low: the regional market is full of inexpensive energy.
We can also plot the day-ahead prices against the residual load. The correlation between the day-ahead prices and the residual load is clear. It should also be noted that the effect tends to be exacerbated for lower residual load.
Since the market prices are lowered when solar is producing, the market value of the solar generation is also lowered. This is the so-called cannibalization effect.
Study with flexible hydrogen production
In a very interesting study, the authors analyzed the potential role of hydrogen production to limit the drop in the market value captured by variable renewables. From the abstract:
While market values may converge to zero in conventional power systems, this study argues that “green” hydrogen production can effectively and permanently halt the decline by adding flexible electricity demand in low-price hours…
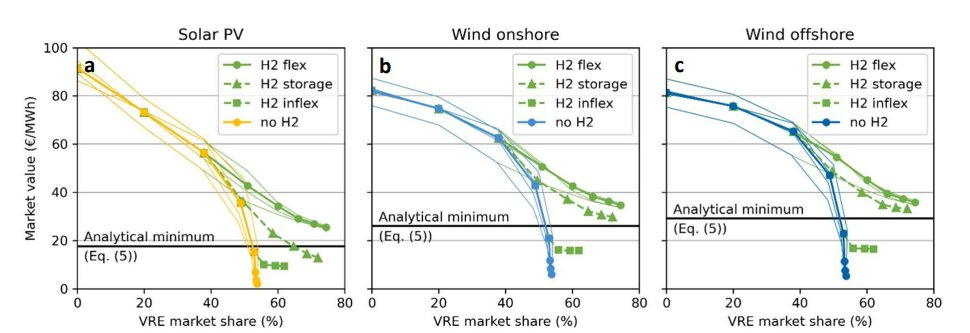
…It is shown that—due to flexible hydrogen production alone—market values across Europe will likely stabilize above 19 ± 9 €/MWh for solar energy and above 27 ± 8 €/MWh for wind energy in 2050 (annual mean estimate ± standard deviation).
Graphically, the drop in market value is shown below. The x-axis is the variable renewables (VRE) market share, i.e. the level of electricity generated by VRE compared to the total electricity generated. The study is making the assumption that one-third is delivered by each main VRE technology: solar PV, wind onshore, and wind offshore. We observe that for a VRE share of around 54%, or 18% per technology, we arrive at a market value very close to 0 EUR/MWh for solar and slightly higher for wind1.

Where are we today?
We are still at the beginning of the curve. Indeed, wind and solar generated a record 22% of EU electricity in 2022. Concerning solar only, the capacity was slightly above 200 GW at the end of 2022 and it produced 7.3% (203 TWh) of EU electricity in 2022.
Concerning wind, it should be noted that onshore wind is currently much more predominant than offshore wind.
Solar: the exponential growth
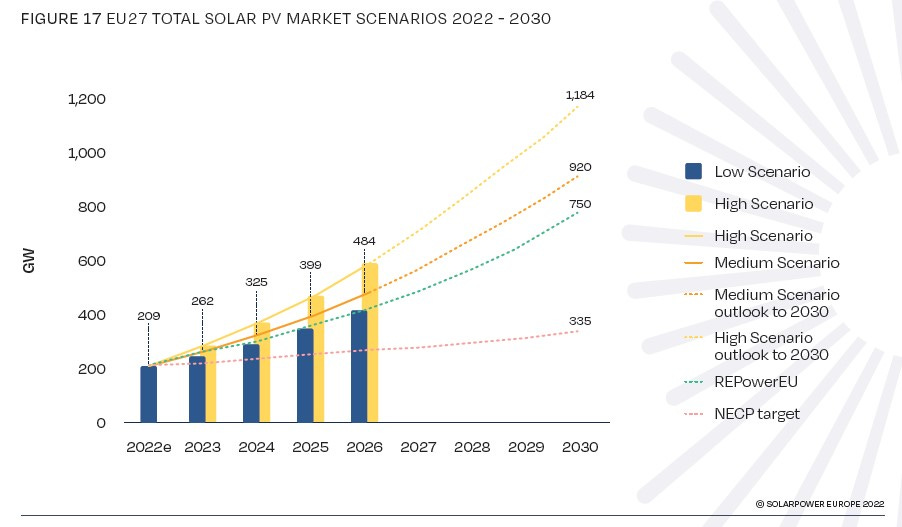
The real game changer is the current growth of solar. Indeed, solar is now growing much faster as you can see in our previous post. The graph below shows the expectations for the EU: 920 GW according to the medium scenario of SolarPower Europe and 750 GW according to REPowerEU.
Let’s assume that the 2,795 TWh produced in 2022 is growing at 2% annually, it would be 3,275 TWh by 20302. In 2022, 203 TWh was produced, in 2030, it would be 761 TWh (23.2%) according to REPowerEU or 934 TWh (28.5%) according to the medium scenario.
Most probably, wind energy will not grow at the same speed as solar. According to WindPower Europe, the onshore and offshore wind must generate respectively 866 and 251 TWh to reach the REPowerEU target. This would represent a share of 26.4% and 7.7%. With the assumption of 750 GW for solar, we have then a total VRE share of 57.3%.
This is actually above the percentage of VRE where solar has a market value close to zero, at the difference that solar would be more than one-third (actually almost half), resulting in an even more pronounced cannibalization effect. If we consider the graph of the study shown above, and since hydrogen electrolyzers would not be widespread by 2030, we can assume that the captured prices would be extremely low3.
Netherlands in May: solar captured only 55%
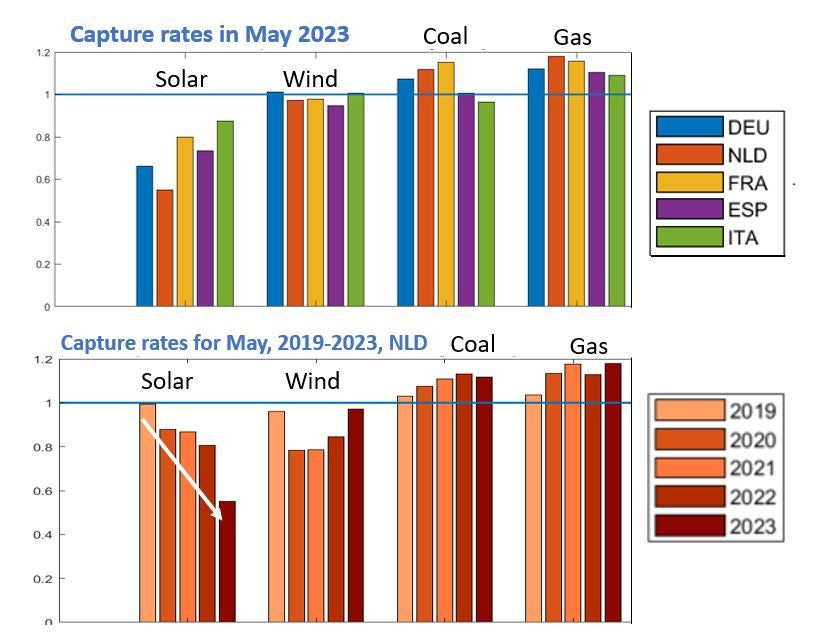
We are not alone in presenting interesting data on the solar cannibalization effect. In a LinkedIn post, Gabrielle Martinelli presented the captured rates of different technologies and wrote:
Cannibalization in renewables is going faster than expected. In the month of May 2023, in the Netherlands, the capture rate of solar power generators settled at 55%. This means that solar power producers could pocket on average 55% of the spot price in that month, due to the fact that power prices in the sunny hours are regularly settling at low and sometimes even negative prices. Interesting to notice (see picture below), just 5 years ago the capture rate for the same technology in the same country in the same month was around 100%!
Of course, the month of May is generally one of the months where the impact is the most visible as solar production is high and the load is low (no need for heating and cooling). Still, solar generators were able to capture only 55% of the average market price, what will it be in 2027 when solar capacity would be 43 GW compared to the actual 18 GW4?
What about flexible demand?
Flexible demand can amortize the drop in market values. There are different sources of flexibility: electric vehicles (analyzed in the post here), heat pumps (a sector in full expansion), electrical storage, and general demand flexibility (industrial load, launching his washing machine at a certain time, etc.). Nevertheless, quantifying the real potential is extremely difficult. What is certain is that, in order to enable a greater role for flexibility, there is a clear need for a generalization of smart meters5 and dynamic tariffs as discussed in the post on the potential of electric vehicles.
In conclusion
Solar is growing at an unprecedented speed, a speed that is certainly not yet understood correctly by policymakers and energy practitioners in general. Even though some solutions exist to enable more flexibility on the consumption side, it is most certainly far from sufficient to catch up with the scale of the current solar expansion. To take the example of the Netherlands, how will the country be able to absorb an additional 25 GW of solar capacity to their existing 18 GW in only 4 years? Consequently, we are expecting a rapid increase in the cannibalization effect, starting with the most difficult months (April, May, September, and October), but propagating to the summer months as well. This could have profound financial consequences on the commercial side of large solar projects (CfD, commercial PPA, etc.) as well as the power sector in general, and the electricity tariffs in particular6.
We hope that you did not expect precise numbers…predicting future captured prices requires a crystal ball that we don’t possess.
Wind onshore and wind offshore are correlated. In consequence, it corresponds to a combined market share of 36% for wind.
This is aligned with the forecasted consumption in 2030 by ENTSO-E.
Of course, this is an interpretation of a model and we should be careful as many aspects might have been missed.
According to the latest report of SolarPower Europe: Global Market Outlook.
Still very much lacking in Germany for example.
What is the logic of a retail tariff constant all over the year in a world where market prices are experiencing large swings every day? This would be the basis for other posts.


Thank you for these posts.
I wonder if we could make a difference between a market cannibalization effect and a grid-physical cannibalization effect?
The grid-physical one reflected to the congestion aspect of the grid-lines, whatever they are dedicated to transportation (~=High Voltage) or local distribution (~=Low Voltage).
It's seems that in some areas the grid-physical cannibalization would be a first - physical - limit to the exponential increase of the impact of increased solar power capacity on market prices.
How do you see this articulation between decentralised and centralised aspects?
Thank you
Very interesting post. A number of people marvel at how many GW of wind and solar are being installed every year. But they don’t seem to ask themselves “what is the value of that electricity?” You clearly show that the value is fairly low, and will continue getting lower for the foreseeable future.