Some data and thoughts on the complementarity between wind and solar
A post on the correlation factors between wind and solar with a focus on Germany and a discussion on the potential for geographical dispersion
In this post, I aim to explore the relationship between wind and solar energy, a subject of relative complexity where definitive answers are not easily formulated. Nonetheless, as global efforts intensify to expand wind and solar capacities, it becomes imperative to grasp the potential synergies between them.
One of the primary observations, and arguably the most crucial, is that the complementarity of wind and solar power varies significantly depending on the geographical location under consideration. In this discussion, our focal point will be Germany, given its status as a leader in both electricity consumption and renewable energy generation. However, when examining regions further south such as Greece, as I will do in this post, the correlation factors exhibit notable disparities.
Furthermore, when zooming out to encompass broader geographical areas, we encounter greater diversity, particularly in wind patterns and shorter temporal scales, as elucidated in this exposition. Nevertheless, as we will see in this post as well, the geographical dispersion has limits on a relatively small continent like Europe, especially for solar energy.
Let’s dive into the topic by starting to look at the complementarity of wind and solar on a monthly timescale.
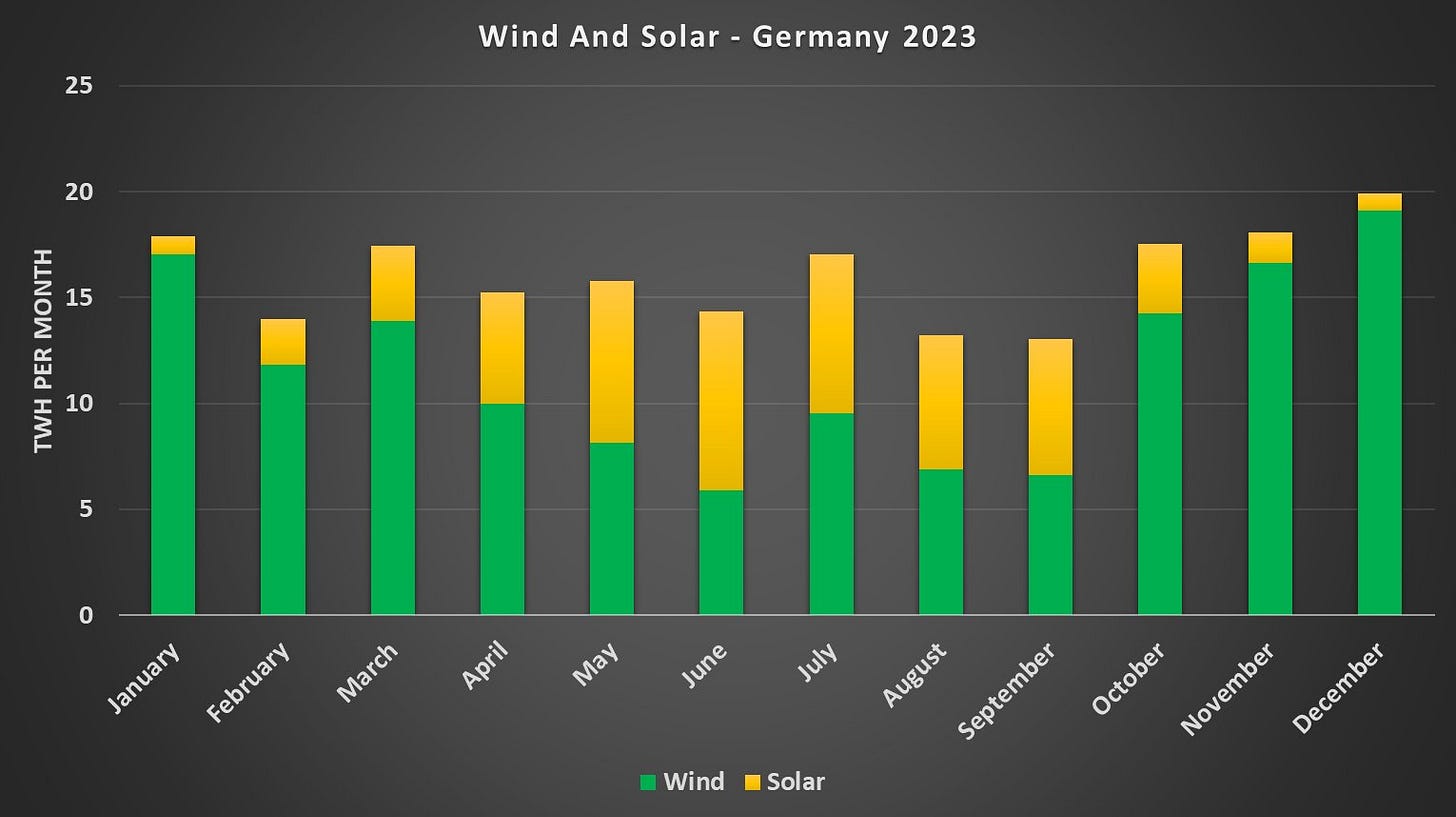
Wind and solar - Germany - Monthly production in 2023
Examining the monthly timescale for 2023 in Germany, we discern a notable degree of complementarity between wind and solar energy sources. Remarkably, there appears to be a surplus, particularly evident during the winter months—a beneficial occurrence given the heightened energy demand during this period.
The observed complementarity holds true for the current balance between wind and solar energy sources. However, it's important to note that this dynamic could shift if the distribution between the two sources changes. In 2023, wind accounted for 72% of the mix, with solar comprising the remaining 28%. Yet, with the recent deceleration in wind capacity expansion juxtaposed against the impressive growth of solar installations, this balance is poised to evolve in the coming years.
For instance, if we hypothetically recalibrate the mix to a 50% wind and 50% solar configuration, significant alterations in monthly energy distribution become apparent. Notably, there emerges a pronounced surplus during the summer months, owing to the higher concentration of solar energy compared to wind, particularly in the latitudes of Germany1. This surplus in summer is particularly detrimental as more energy would be required in winter as we progressively electrify heating, and as long as cooling is not preponderant2.
Hence, there is indeed a degree of complementarity between wind and solar energy on a monthly basis, yet this symbiosis is highly contingent on the specific proportion of each technology in the energy mix. As previously mentioned, it remains vital to uphold a significant presence of wind energy within this balance. This underscores a fundamental reality: the interchangeability of one kWh of wind energy with its solar counterpart is not straightforward.
This assertion resonates with my earlier discussion regarding the limitations of using the Levelized Cost of Energy (LCOE) as a metric for comparing various energy technologies, including wind and solar.
The weekly timescale
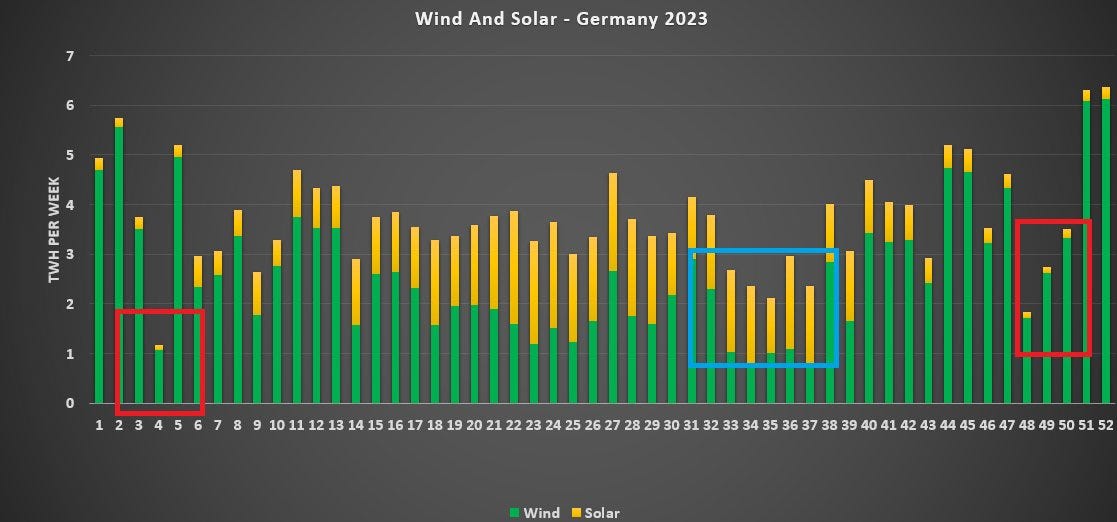
Shifting our focus to the weekly timescale reveals a less favorable picture of complementarity between wind and solar energy. Throughout the observation period, there are weeks characterized by significantly diminished generation levels, with one particular week registering a mere 18.3% of the peak generation and 31.5% of the average. These instances of reduced renewable energy output, often referred to as "Dunkelflaute", predominantly occur during the winter months, as indicated by the red boxes in the data.
However, it's noteworthy that the challenges extend beyond the winter season3. Towards the conclusion of summer, we also encounter consecutive weeks marked by low renewable generation, as illustrated by the blue box. This underscores the nature of wind and solar sources and emphasizes the importance of developing strategies to mitigate such periods of diminished generation.
A recurring conclusion that has been emphasized in previous discussions is the correlation between low renewable energy generation and elevated prices on the day-ahead markets. This relationship becomes particularly evident during week 37, coinciding with one of the weeks highlighted in the blue box. During this period, we can discern a notable impact, with both the day-ahead and intraday markets experiencing significant price spikes.
When comparing the average market prices with the total generation of wind and solar on a weekly timescale, we find a relatively strong correlation, with a correlation coefficient of -0.74. By contrast, the correlation coefficient between natural gas and weekly prices stands at a comparatively weaker 0.55, indicating a less robust relationship. Moreover, the correlation coefficients with the load and the residual load are notably distinct, registering at 0.51 and 0.9, respectively.
The hourly timescale
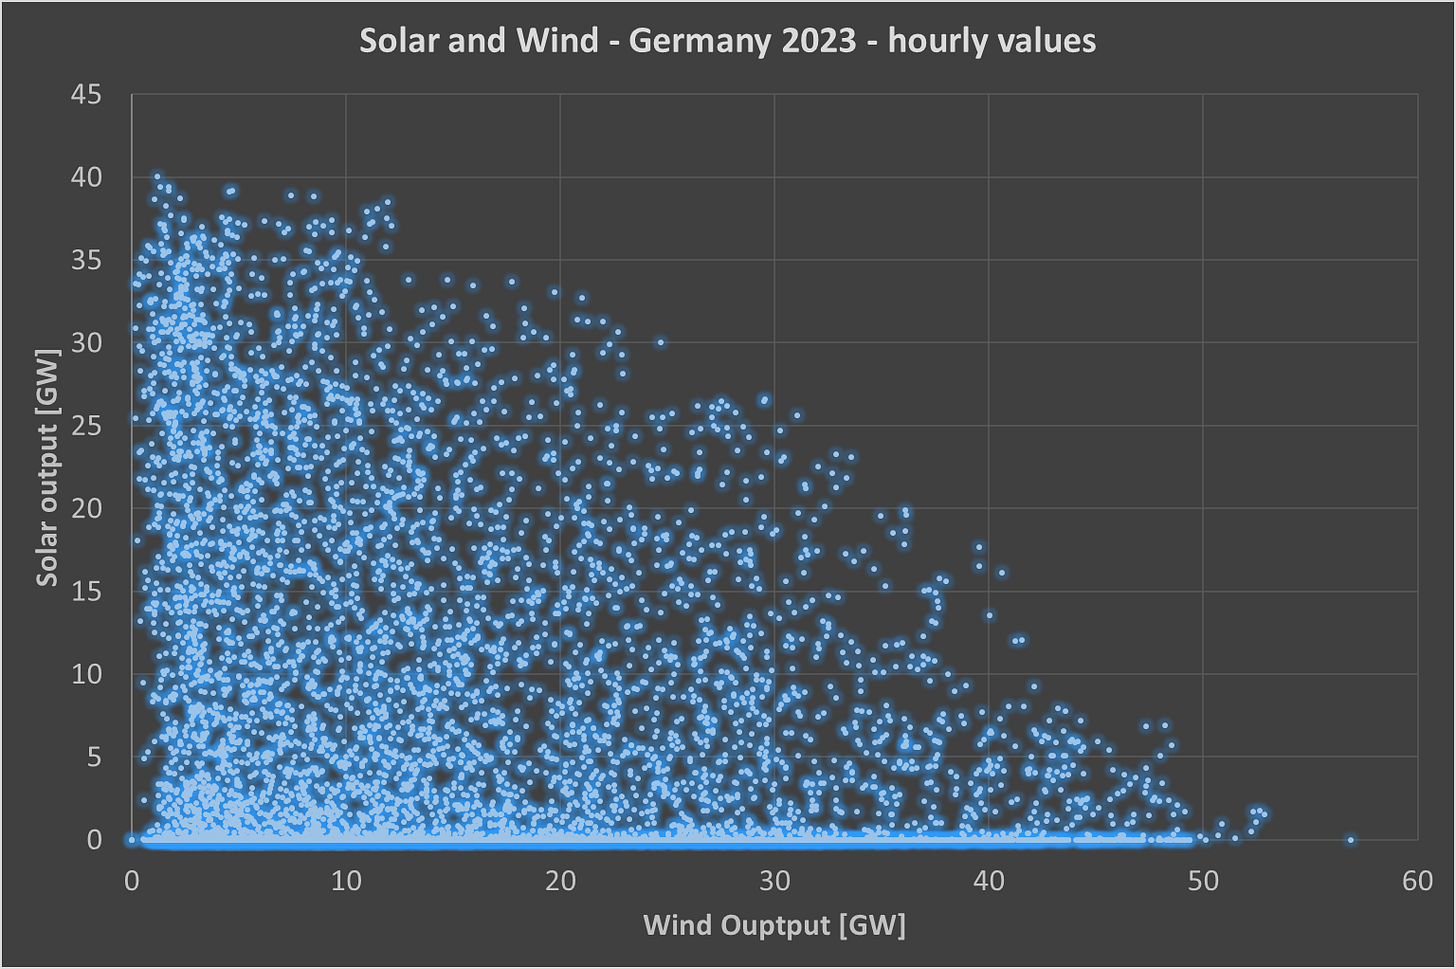
Concerning hourly timescale, the complementarity is greatly reduced, with minimal correlation observed between solar and wind energy generation.
We should not understand this poor correlation between wind and solar as chaotic. Wind and solar output do not vary abruptly generally from one hour to another, but they generally vary over several hours. Hereunder we can see the curves of onshore wind, offshore wind, and solar for one week in February 2024, as well as the load and the residual load. Even though we have large differences between different hours of the week, we do not see drastic increases and decreases from one hour to another.
Correlation factors
As we have seen earlier, the complementarity between wind and solar depends on the timescale considered. A way to understand this is to present the correlation factors for different timescales. Hereunder are the correlation factors for Germany in 2023 between wind, solar, and the load.
We observe a distinct pattern where monthly values tend to exhibit stronger correlations: both wind/solar and solar/load pairs display notably strong negative correlations, while wind/load shows a marked positive correlation on a monthly timescale. This can be attributed to the increased consumption and wind production during winter, contrasting with solar generation.
However, when scrutinizing hourly data, correlations diminish across all pairs. Of particular interest is the poor weekly correlation between wind and load, suggesting prolonged periods with lower wind and heightened demand. Additionally, the weekly correlation between wind and solar is weaker as well. This discussion underscores the potential necessity for storage solutions spanning several days.
When examining a country situated further south, such as Greece, which boasts a prominent position as a solar energy leader in Europe4, we encounter markedly different correlation results. In this context, the correlation factors between wind and solar, as well as between wind and the load, appear to be considerably lower compared to Germany's metrics. Unlike the situation in Germany, where wind correlates more strongly with the load, in Greece, solar demonstrates a relatively good correlation with the load. This suggests that solar energy tends to be more productive precisely when energy consumption is higher, reflecting a notable contrast in energy dynamics between regions.
The elevated correlation observed between solar energy and electricity consumption in regions like Greece can be attributed to increased energy demand during the summer months, primarily driven by the need for air conditioning. This heightened consumption is clearly evident in the graph provided below.
Continental cooperation - geographical dispersion
An additional noteworthy consideration is the potential for geographical dispersion across different countries, often regarded as a strategy to mitigate the variability of renewable energy generation. In this context, we'll examine the correlation between Germany and France, as well as between Germany and Spain.
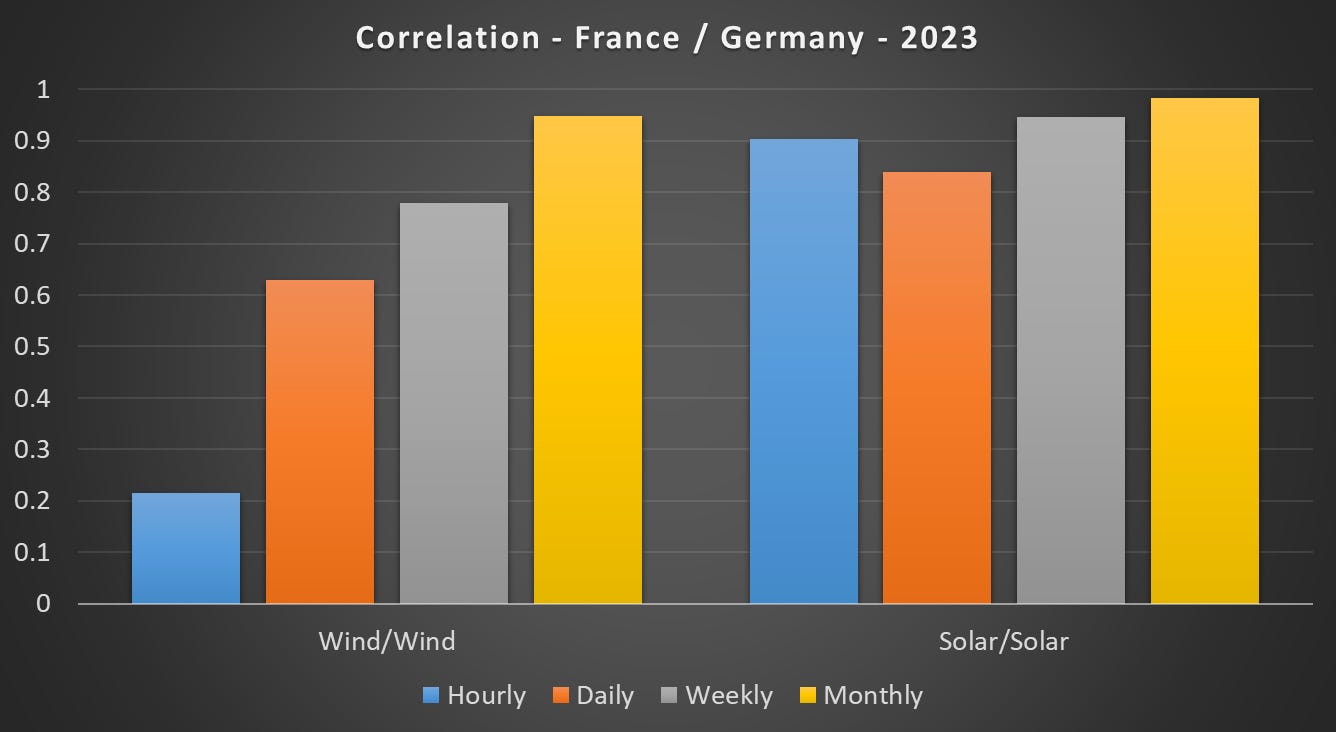
An ideal scenario for geographical dispersion entails a low correlation between the energy output of two countries, signifying that the production in one country is not strongly tied to the production in the other5. However, as observed in previous discussions, the correlation factors vary across different timescales, with solar exhibiting higher correlations compared to wind.
Beginning with France and Germany, the correlation for wind energy is already notably high for daily values and increases further for monthly values, suggesting a limited potential for geographical dispersion. Similarly, solar energy displays high correlations across all timescales considered. Consequently, the ability to smooth out renewable energy generation between the two largest countries in Europe, especially on a monthly and possibly weekly level, appears constrained.
When examining the relationship between Spain and Germany, we find that the potential for geographical dispersion is notably improved, particularly for wind energy, extending up to the weekly level. Across various timescales, correlation factors between the two countries' wind energy outputs are relatively low, except for the monthly value. Conversely, for solar, a significant relationship remains, particularly evident on the monthly level.
This observation aligns with the logical expectation, considering that Europe is a relatively small continent, where geographical proximity can influence the interconnectedness of renewable energy generation across different countries.
Final thoughts
The central message of this post underscores the intricacies inherent in the relationship between wind and solar energy. While there exists a degree of complementarity between these two renewable sources, it is far from flawless. Analyzing this dynamic necessitates a comprehensive examination across various timescales and geographical territories, rendering simplistic conclusions challenging to draw. In addition, the generation output should also be compared to our actual needs in terms of electricity consumption as well as our ability not to store excess electricity cheaply6.
While acknowledging the complexity that precludes simplistic conclusions, I am compelled to highlight several key points that remain important to me.
Wind power appears to be better suited for Northern European countries, primarily due to the close relationship between heating demand and wind patterns in these regions. Conversely, Southern countries tend to derive greater benefits from solar energy, as their heightened demand for air conditioning aligns with increased solar generation.
At an hourly level, the correlation between wind and solar energy is virtually non-existent, or at best, weak. Consequently, there arises a pressing need for storage solutions to effectively mitigate the hourly variations in renewable energy generation. It is widely anticipated that large-scale batteries will likely assume this pivotal role in the future, although substantial deployment is necessary to realize a significant impact.
A significant challenge arises from the weekly variations in renewable energy generation, necessitating the implementation of larger storage solutions capable of storing energy for several consecutive days. While traditional batteries may address some aspects of this challenge, innovative technologies like thermal storage and Iron-air batteries7 hold promise in providing some solutions.
Countries endowed with hydroelectric power and ample reservoirs enjoy a distinct advantage, as they can effectively mitigate the fluctuations in generation output over extended periods. As previously discussed, Nordic nations hold a significant advantage in this regard, as do certain other regions such as those in the Balkans.
Lastly, hydrogen emerges as a frequently touted option to address the challenges of balancing renewable energy. However, the development of green hydrogen, derived from renewable sources, is still in its early stages. In addition, I firmly believe that green hydrogen holds numerous potential applications before its immediate use for electricity production.
As always, I encourage you to share your feedback on this post, including your own perspectives and opinions. Your input is valuable and contributes to enriching the dialogue.
The difference between summer and winter output is decreasing as the country is closer to the Equateur.
Some regions of the world have a much larger load during summer due to cooling, such as California for example.
Of course, analysis over multiple years would bring a better representation of the real situation.
Greece had the higher share of solar in its electricity mix in 2023 according to Ember.
Mathematically, we could have a non-linear correlation but this seems impractical in the context of renewable generation between two different countries.
Hourly variations might well be less relevant if batteries are being installed massively, even though, I believe that the current rate of installation is not yet sufficient.
See the work of Form Energy for example.


Great graphs thanks. The monthly correlations of wind with demand are interesting, especially for future heat. Very large stores of hot water linked to heat networks have a lot to offer Northern latitudes. (though ultimately underground storage of coolth may prove more essential for human survivability in the South) Adding a street heat network may enable existing power connections to be used with ASHPs etc to INPUT heat into a network for transfer to central mass thermal storage for use later. Online webinar in English: https://topsectorenergie.nl/nl/kennisbank/webinarreeks-warmteopslag/
IRENA has some thermal storage publications.
Should we make price differences bigger to stimulate thermal storage investment and the use of electricity instead of oil and gas combustion fuels?
e.g. Stop adding fixed levies and taxes onto retail kWh prices, perhaps removing them one week, doubling them the next?? To stimulate Demand Side and long duration thermal storage Investment?
@AndyFrewX
I’m a keen reader of your posts and do agree that numerical analysis like yours’ are important to start to understand the issue at hand. Nevertheless, is it not correct to say that intra-day solar output is 0 for more than 50% of the time greatly reducing whatever solar/wind correlation you might find at larger timescales? One can argue that on a yearly scale countries like Spain might already have, or are close to having, all the solar/wind capacity installed required to potentially cover yearly demand, but that doesn’t solve the 24 hour cycle. I’m coming from my own small personal experience as I built a 100% off-grid house on the Mediterranean coast of Spain which went live back in the summer of 2020. I was surprised after a full year to find out that I had to rely on my backup gas generator (sounds familiar?) much more often than the “models” predicted. I’m traveling now but if you’re interested I can give you all the details about the installation, production and demand, as well as how much more PV and battery capacity I had to install just to achieve the objective of 98% independence.