


The German aFRR capacity market - a deeper look on prices

The aFRR capacity market is a an important component of the European power systems. Despite its significance, detailed insights into the price dynamics of this market are relatively scarce. Therefore, this analysis aims to shed light on these dynamics and provide a deeper understanding.
A quick introduction
Last year, I shared a post detailing the evolution of aFRR capacity prices across several countries. In essence, aFRR plays a vital role in grid balancing. Most European nations procure aFRR capacity, typically prior to the gate closure time of day-ahead auctions. Subsequently, providers of aFRR capacity are required to submit aFRR energy bids that correspond to the procured capacity1 which are then activated based on the needs of the TSO2.
The focus of this post is on German capacity prices. Germany currently organizes a daily capacity auction in collaboration with Austria, addressing a common demand of approximately 2 GW (with about 10% allocated to Austrian demand). The auction has the following characteristics:
It is divided into six blocks of four hours each (e.g., 0 to 4 AM, 4 to 8 AM) and differentiated for upward and downward directions.
The market algorithm is run at 9 AM and results are published afterwards, following the FCR (primary reserves) and preceding the mFRR (tertiary reserves). Importantly, this publication occurs before the day-ahead market.
The auction operates on a pay-as-bid basis, meaning bidders receive the price they submit. This contrasts with energy auctions (day-ahead and intraday auctions) and differs from some other European aFRR capacity markets. As a result, market participants are incentivized to estimate the marginal price and bid accordingly (this will be discussed later in this post).
Before diving into the insights, I want to emphasize that future market conditions may change significantly from previous years. A key factor to consider is the rapid uptake of Battery Energy Storage Systems (BESS), which can provide aFRR capacity. This surge in battery deployment, occurring simultaneously across many European countries, will enhance competition in the aFRR capacity markets. Consequently, prices may increasingly be determined by the opportunity cost of BESS3.
Besides this note on the potential evolution of the aFRR prices, let’s now start the review of historical prices. All data on aFRR prices are available on this link.
The order of magnitude
In 2024, the average aFRR capacity price was approximately 13 €/MW per hour for upward capacity and 10 €/MW per hour for downward capacity. These costs are expressed in €/MW per hour, meaning the price to reserve 1 MW of capacity to either increase or decrease generation, or alternatively, to decrease or increase consumption. The yearly distribution of these prices is illustrated below.

Assuming a demand of around 2000 MW, these capacity prices equate to approximately 420 million euros per year. In 2023, electricity consumption in Germany and Austria was 463 TWh and 63 TWh respectively, leading to a cost of 0.8 €/MWh of electricity consumed. This represents roughly 1% of the average power price in 2024. Consequently, while the absolute value (420 million euros) might seem substantial, it is relatively low in percentage terms.
Historical overview part 1 - rolling averages
Firstly, to provide some historical perspective, here is the graph showing the 28-day rolling average for upward capacity (yellow line) and downward capacity (blue line) since 2021. The Y-axis on the left pertains to these rolling averages. On the right Y-axis is the rolling average of day-ahead prices (green curve), offering insight into the general level of power prices at that time. A comparison between day-ahead prices and aFRR capacity prices for 2024 will be made later in this post.

We can observe the following elements:
There have been several peaks, notably in October 2021, summer 2022, and late spring/early summer 2023.
While the peak in summer 2022 could be somewhat associated with elevated day-ahead prices, the peaks in 2021, and especially the peak in 2023, do not appear to be directly linked to day-ahead prices4.
The rolling averages for upward and downward capacity prices are quite closely aligned, with the exception of late 2024.
Downward capacity prices appear to be relatively low during the past three winters, whereas prices during spring and summer of 2024 seem to be consistently higher, forming a noticeable 'bump.
It is important to note that these rolling averages do not differentiate between the various time blocks, a significant distinction that will be explored further below.
Historical overview part 2 - heatmaps
Hereunder is three heatmaps of the last 4 years per month and per product. I used the same colors, but the scales are not similar for the three heatmaps.
Monthly average price per product
The first heatmap shows the average monthly price per product. The downward capacity is on the left. We can clearly see that solar has an impact on downward aFRR (higher prices for block 12 to 16 in spring and summer).

Maximal daily average price per month and per product
The second heatmap shows the maximal daily average per month and per block.

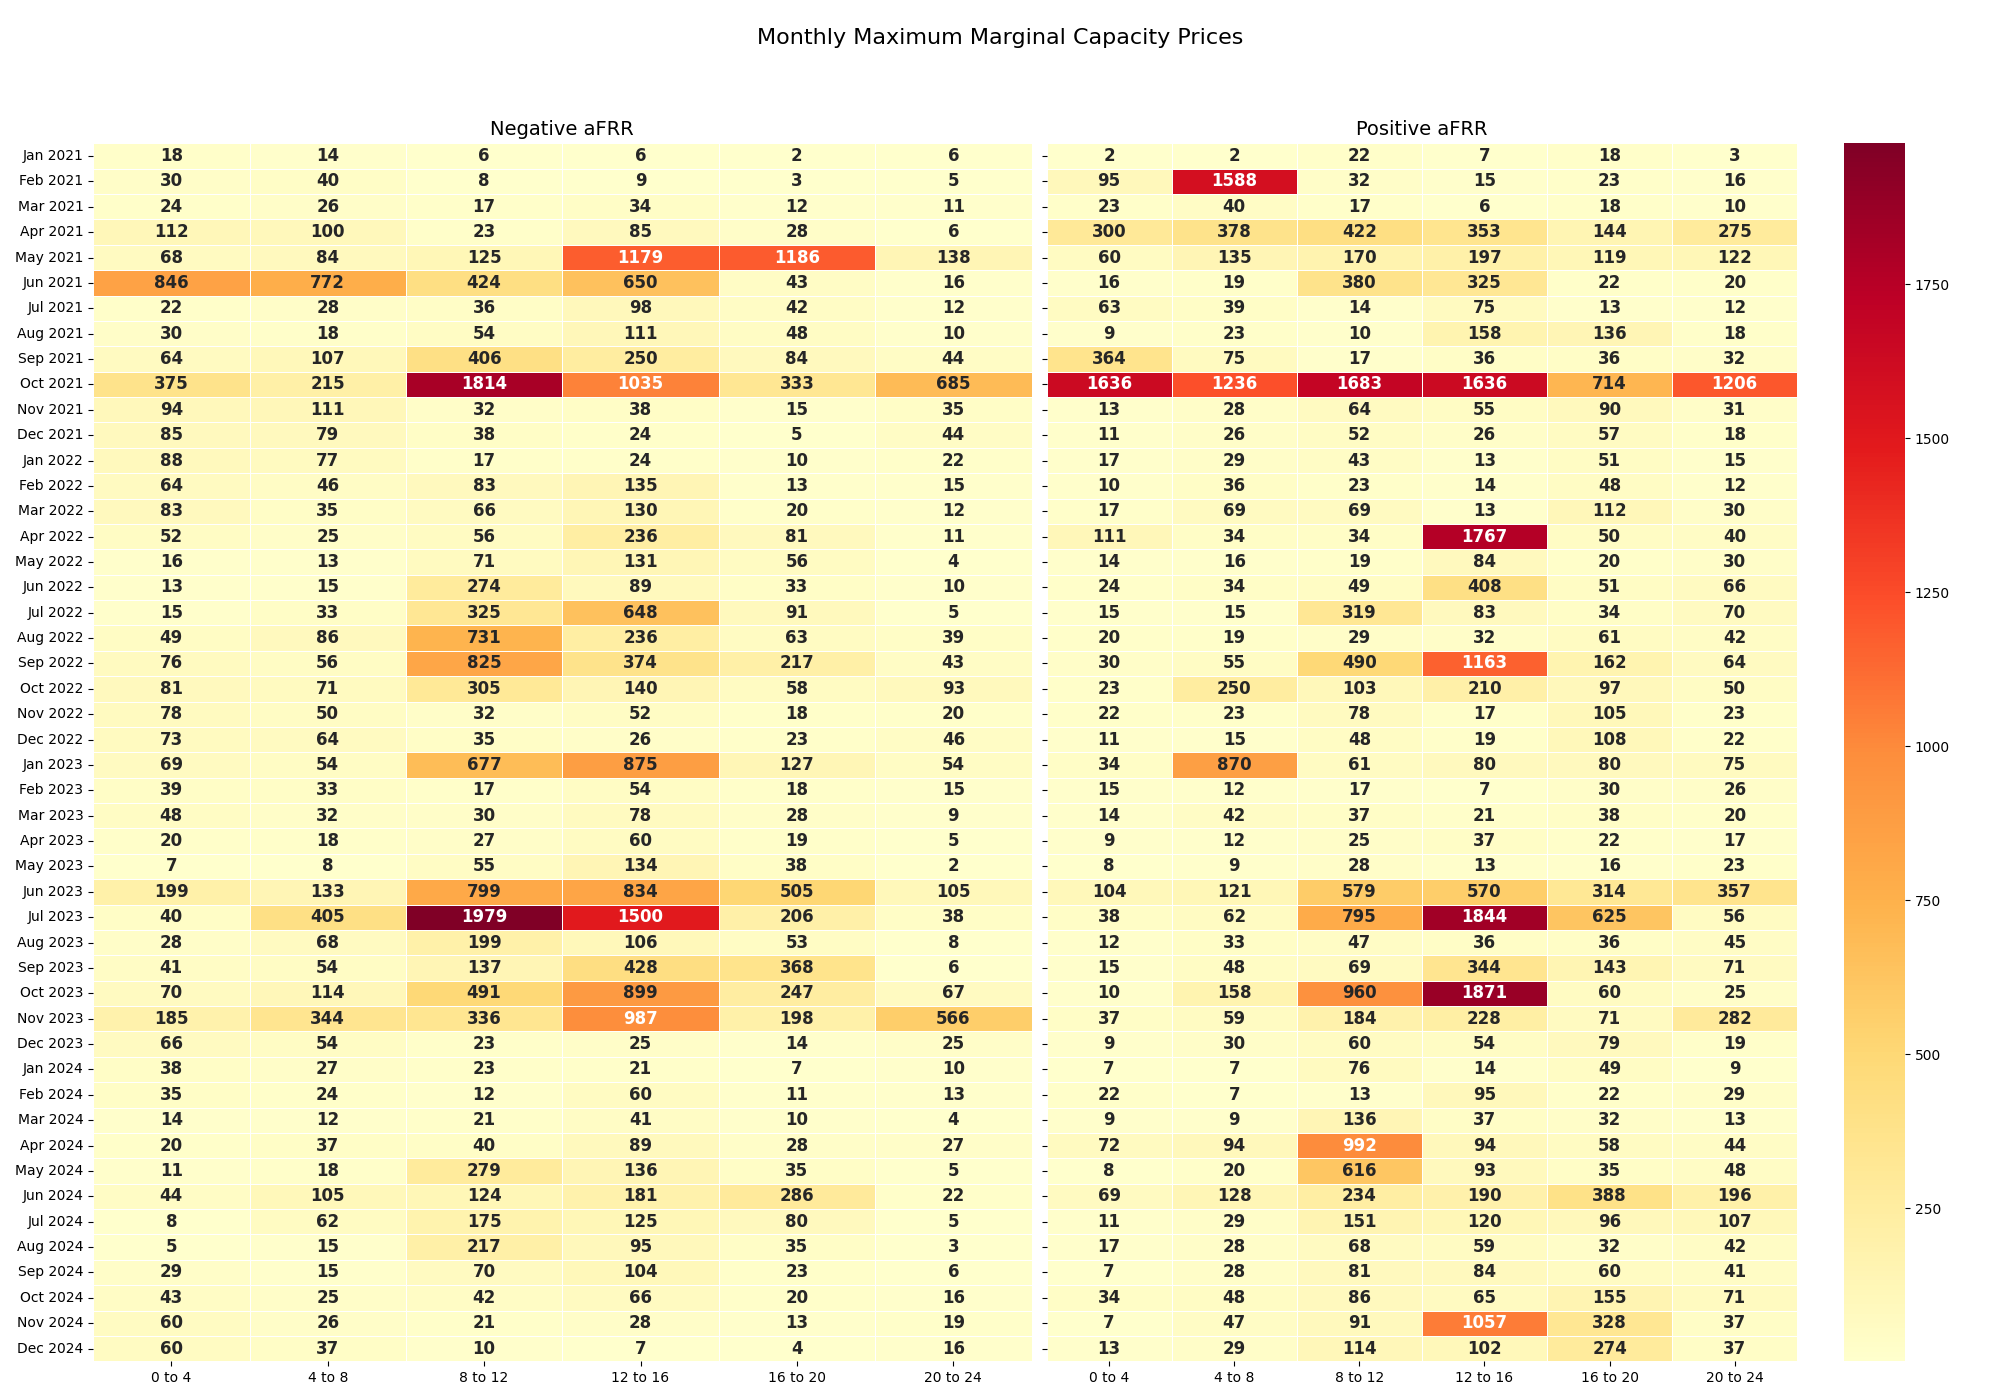
Marginal capacity bid per month and per product
Finally, here is the maximal selected bid price per month and per product. It basically shows when were the large peaks. We can see that sometimes prices go up to almost 2000 €/MW per hour.
Focus on 2024 - upward aFRR
Let’s focus on 2024, as the overviews above are a bit too large. First, the main principle of aFRR up capacity is that power plants that are selected in the day-ahead markets and have a capacity margin to increase their output will provide relatively cheap upward capacity reserves. The main prequalified capacity is hydropower plants (dark blue), biomass (green) and gas power plants (yellow). Storage is increasing, with now 330 MW of prequalified power (data from February 2024).

If we focus on the year 2024, we observe higher prices during the peak hours, which ar 20 to 24 in summer and 16 to 20 in autumn and spring. We also observe some more elevated prices for the morning peaks (8 to 12). Interestingly, we observe higher prices this winter during peak hours than during the previous winter, suggesting that peak capacity has been less available. This has also been seen in the day-ahead markets actually, with prices attaining 936 €/MWh on 12 December 2024, while the maximal day-ahead price has only been 261 €/MWh for the winter 2023-2024 (November 2023 to February 2024).

Examining the monthly maximum prices reveals that the recent winter experienced far more extreme prices compared to previous winters. By comparing November and December's records with the end of the previous winter, it is clear that recent price levels were significantly higher (even though the end of 2023 saw some increases, they never reached the levels seen recently). I've discussed these observations in detail in my previous post, which you can view here.

Focus on 2024 - negative aFRR capacity
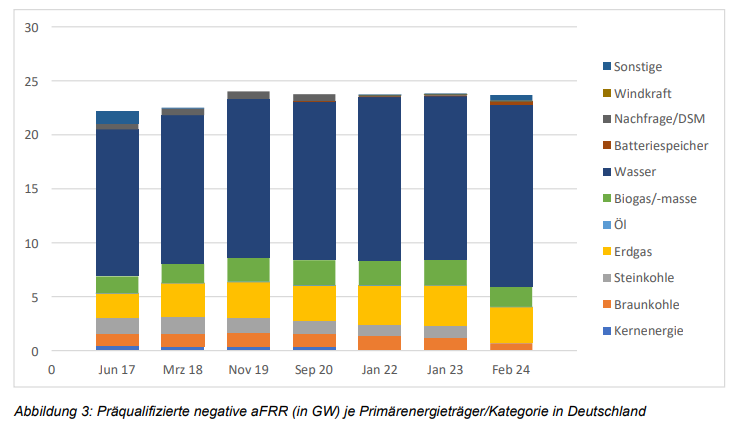
The primary driver for downward aFRR capacity prices is the volume of power sources dispatched in the day-ahead markets that have downward capacity available. Power plants that are dispatched in energy markets but can reduce their output within the required timeframe for aFRR typically provide inexpensive downward aFRR capacity. The following graph depicts the evolution of prequalified capacity for providing downward aFRR in Germany. The majority of this capacity is hydropower (dark blue), followed by gas power plants (yellow), and biomass (green). Recently, batteries have started to emerge (with 310 MW prequalified in February 2024), whereas wind power remains (almost) nonexistent and solar has no prequalified capacity.
The fact that renewables do not yet provide much downward aFRR capacity creates a clear correlation between renewable penetration and the price of downward aFRR capacity. Below is the average monthly price per block in 2024. We can clearly see the impact of solar penetration during the spring and summer months, particularly for the blocks from 12 PM to 4 PM. In fact, nearly 30% of the market value is concentrated in just five blocks, out of the total 96.

Below is the maximal daily average price per month and per block. As illustrated, some blocks remain very low, which indicates that the average price during these months consistently stayed low (for instance, the blocks with a maximal daily average of 2 €/MW per hour).

A look at the merit orders
As the aFRR capacity auction is a pay-as-bid, the exercise that most bidders must do is to estimate what will be the latest selected bid and bid accordingly. Most of the time, the merit order is increasing fast to reach a certain plateau, indicating that most selected bidders are not that far away from the marginal bidder. Hereunder is for example the merit order to all positive products of October 1st.

Nevertheless, we have a few instances when the marginal cost is clearly not aligned with the average prices. Hereunder are the five instances in 2024 for up and down with the highest marginal bids. We can observe that when high prices occur, there is a certain amount of surprise and most bidders are unable to capture these high marginal prices.

Below is another perspective on the merit order, depicting the percentiles of the merit order for the peak periods from 16:00 to 20:00 during the first 15 days of November (illustrated by the purple curve in the graph above for the upward direction). As shown, the dispersion is significant, with the bottom 20% of the lowest bids on November 6 being half the price of the top 20% of bids. Interestingly, the curves are much closer on the following day, despite the 50th percentile remaining at the same level. Could this indicate that bidders were better positioned the day after? We observe a similar phenomenon on November 12 and 13.

aFRR capacity market and residual load
As mentioned earlier, the prices of aFRR capacity are generally linked to the availability of power plants that are in the money in the energy markets, and notably the day-ahead market. One indicator that could be used is the residual load, defined as the load minus the generation from wind and solar. The two graphs below present scatter plots of the capacity costs compared to the residual load (the average over the four hours of the considered blocks).
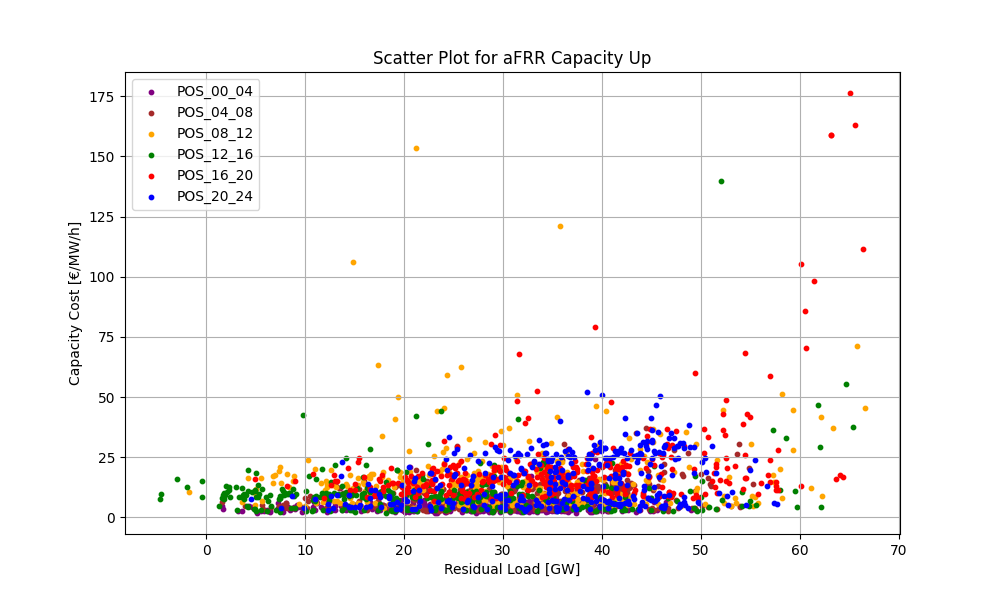

We can observe the following:
For up, the prices are only slightly impacted by the residual load, except for (very) high residual loads5. This reflects the moments where capacity becomes scare, and generally day-ahead market prices are high. Therefore, reserving some spare capacity could come with a certain opportunity cost.
For down, the link is clearer. Low residual load (or even negative residual load) comes with a higher cost for reserving downward capacity. This can also be seen clearly when we only consider the afternoon blocks 12 to 16 and compare it with solar, as shown below.

Obviously, market dynamics, especially corresponding to solar generation but also to peak prices during “small Dunkleflaute” are not necessarily matching the current 4 hours block division. This is why the German TSO are currently looking to reduce the granularity of the aFRR capacity to 15 minutes (as well for mFRR capacity). More details are available here.
The trend
Naturally, the million-dollar question is: how will the prices develop? As I mentioned in a previous post, large-scale batteries are being rapidly installed throughout Europe, including Germany. These batteries are beginning to penetrate the aFRR market significantly; from 2023 to 20246, prequalified power increased from virtually nothing to over 300 MW. Though there is still some way to go before batteries become the predominant providers, 2000 MW is not particularly so high relative to the current rate of installations.
In a market with a substantially higher number of BESS, the costs of these assets are likely to determine prices at many points in time. Since these assets are constantly seeking optimal market opportunities, they will likely bid capacity prices based on their opportunity costs from other market potentials. Securing a capacity band for aFRR limits their ability to trade in intraday markets, for instance, and this opportunity cost will be reflected in their bidding strategy in the aFRR capacity market. Of course, there will be instances where batteries are not the cheapest option, as other assets will be available—as demonstrated by the aFRR downward capacity prices for all the 20-24 blocks or all the aFRR upward capacity prices for all the 0-4 blocks in 2024.
So, I would expect that aFRR capacity prices to progressively reduce with the increased competition from the arrival of BESS and consequently, to have a stronger link between aFRR capacity prices and opportunity costs for these assets.
Stay tuned for another similar analysis next year!
Free energy bids are generally allowed, i.e. market parties that have not been selected in the capacity markets can still provide aFRR energy bids.
Regarding aFRR energy activations, there is an ongoing initiative to couple European markets under the Picasso platform.
Nevertheless, maybe the one of 2021 might have been linked to the relative surprise of the start of the energy crisis around October 2021.
There are a few outliers in the blocks 8 to 12, which one potential explanation could be the solar ramping up during these blocks.