European power reserves: part 2 - aFRR (and how solar is impacting it)
Second post on power reserves, exploring the automatic Frequency Restoration Reserves, with a strong focus on Germany, Belgium, and the Netherlands.
After discussing FCR in the first part, this post is exploring another power reserves, the automatic Frequency Restoration Reserves (aFRR), previously called secondary reserves. Contrary to FCR, this power reserve is relatively less harmonized in Europe, even though there is an on-going effort to harmonize it. As gathering and analyzing data on each individual European country is a tremendous task, I will focus in this post on three markets: Germany, Belgium, and the Netherlands.
Similarly to FCR, the impact of renewables, and especially solar, on the prices of aFRR is far from negligible. The main reason is that solar is pushing traditional power plants out of the merit order on the wholesale markets, reducing the available flexibility. Therefore, the price of power reserves is increasing and in some cases, quite drastically. In this post, I will present this phenomena with the help of tables and graphs. To be clear, I want to emphasize that it is not intrinsically bad but it is a feature of the current system. Power markets dominated by renewables do have different characteristics, including in terms of prices of power reserves, than grids dominated by gas, coal, hydro, or nuclear power plants.
aFRR in a nutshell
The automatic Frequency Restoration Reserve is one the power reserves in Europe, playing a crucial role in maintaining the balance of the electric system. This reserve is typically activated within a maximum of 5 minutes1, in response to a centrally dispatched signal from the Transmission System Operator (TSO)2. aFRR, the second fastest reserves after FCR, was formerly known as secondary reserves. For a more detailed understanding, you can refer to this source.
Unlike FCR, which only has a cost for the reserved capacity, aFRR comprises two components: a capacity component and an activation component. Auctions are regularly conducted in various countries to procure the capacity3. This ensures that TSO can rely on providers to adjust their electricity portfolio upwards or downwards as needed. All bidders selected in the capacity auctions are required to submit energy bids for the activation component. Typically, non-selected market parties can also participate in the energy activation auctions.
In this article, the focus will primarily be on the capacity components, although the energy component parts will also be briefly discussed. It's worth noting that the energy component often influences the imbalance price, which is the price considered when your portfolio is not balanced4. A comprehensive discussion on the imbalance price will be the subject of an upcoming article.
The difficulty of comparing aFRR
Even though there is an effort to harmonize power reserves across Europe, there are still sensible differences. Product definitions (FCR, aFRR, and mFFR5) have been relatively well aligned but some major differences remain such as: the volumes of each reserves (see below), the way the reserves are used, the procurement methods (compulsory provision, weekly tenders, daily tenders, etc.), etc. In addition, some countries are also counting on additional market efforts to balance their system, such as passive balancing (Belgium and Netherlands) or a liquid near real-time intraday market (for example, Germany)6.
One interesting difference is related to the quantity of procured aFRR compared to the size of the system. The graph below presents the average aFRR procured divided by the annual electricity consumption7. We can observe that both in Belgium and France, the procured aFRR is half the ones of Netherlands, Germany, and Austria.
Furthermore, each country has its own generation mix and own characteristics which lead to important differences for the aFRR prices, both in terms of capacity and energy activation prices. Some countries might be impacted differently by a lack of flexibility, while some other might have ample sources of flexibility available at any moment (for example, countries with ample hydro power plants).
Nevertheless, as I have described repeatedly in previous posts, solar growth is probably one of the most important factor of the coming years. One of the particular feature of solar in Western Europe is that solar is concentrated on some hours only8, which would mean that when the sun is shining, traditional assets would be out of the merit order, leading to a decreased availability of flexibility options and therefore higher prices for flexibility.
Let’s now look at the capacity prices and try to find out the signs showing that solar is already impacting significantly our systems, and in particular aFRR markers.
aFRR capacity prices in Germany and Austria
Let’s start by Germany and Austria. Germany is procuring around 1900 MW of aFRR in both directions while for Austria, it is 200 MW. All the data concerning the procurement of power reserves can be found on the Regelleistung website. Procurement of aFRR is done conjointly for both countries on a daily basis in blocks of 4 hours, similar to FCR procurement. There is also an effort, called ALPACA, to extend the joint procurement to additional countries.
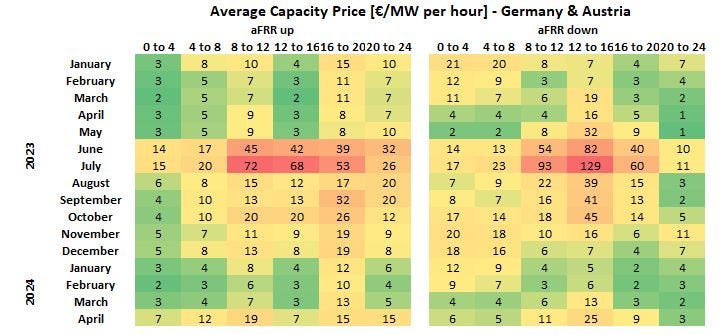
The tables below present for both aFRR upward and aFRR downward the average prices per month and per block in 2023 and in the first four months of 2024. We can observe the following:
June and July 2023 were two months when aFRR capacity prices were much higher than usual.
aFRR up capacity prices are negligible during the night and the during the afternoon in winter.
The fluctuations from one block to another are very large, from 1 €/MW per hour to 129 €/MW per hour, demonstrating that price for flexibility is actually very “flexible” itself.
The most expensive blocks happen to be when solar is producing, especially for downward flexibility.
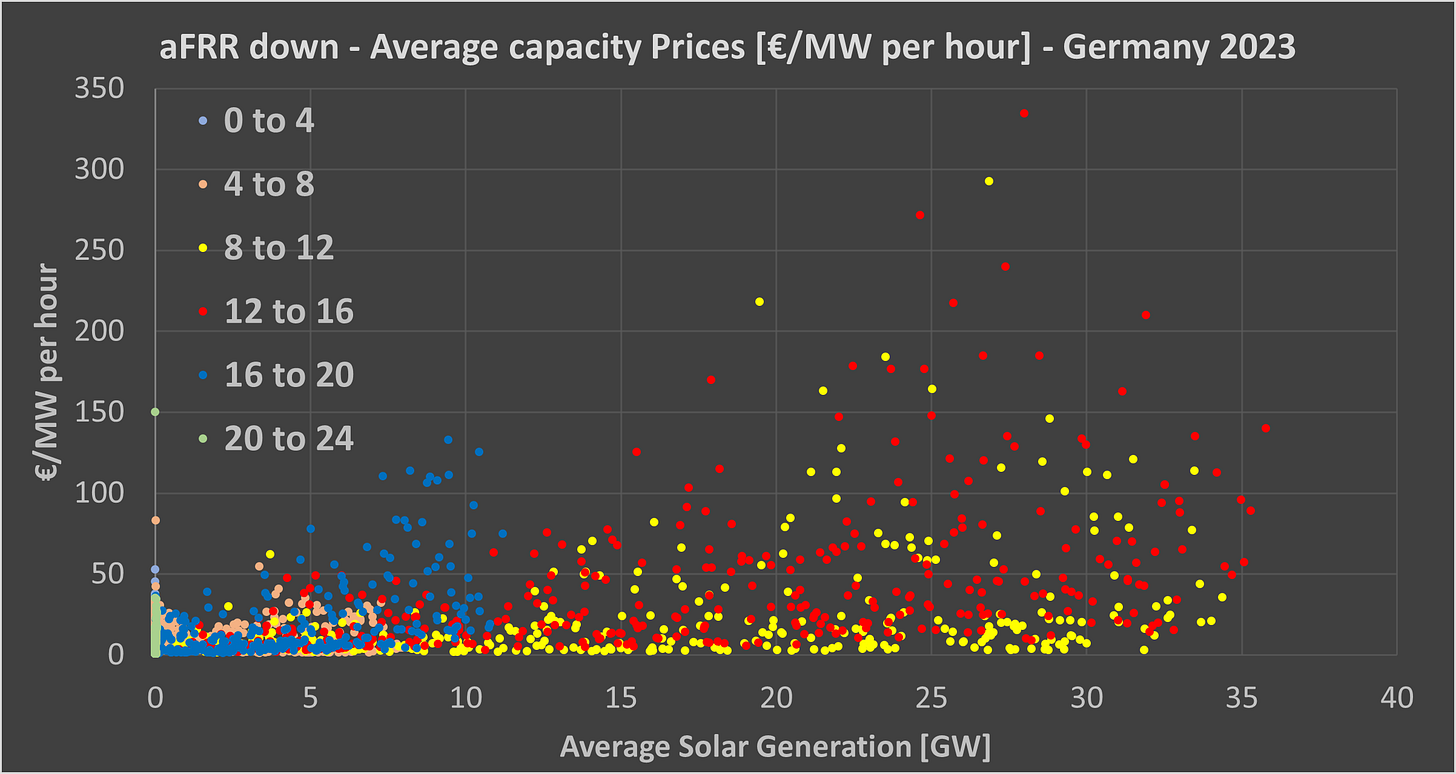
The following scatter graphs present the same information but compared it with the solar generation. Each color is a different block for the year 2023 (365 points per block). The first graph is for aFRR upward and the second one for aFRR downward.
As we can observe, the most expensive capacity prices happen when solar is high, which happens mostly for the blocks 8 to 12 and 12 to 16, and a bit less for the block 16 to 20. As shown in the tables above, aFRR downward is more impacted than aFRR upward, even though the average price of aFRR upward over the year is more expensive than downward (18 €/MW per hour compared to 15 €/MW per hour).
On average, we therefore observe some spikes in prices when solar is high9. The good thing is that for downward flexibility, solar could also potentially be part of the solution. Indeed, there is no physical barrier that would completely impede solar to decrease generation when the system requires it. If prices are interesting enough, which I believe it would be the case increasingly, we can imagine market players bidding solar capacity into the aFRR capacity markets10.
aFRR capacity prices in Belgium
Unsurprisingly, Belgium is facing a similar trend than Germany, even though the total volume procured is much lower than in Germany, including compared to the system size. Hereunder I highlighted for aFRR downward two different months: January and May 2024. In Belgium, the procurement is done via the same blocks as in Germany but there is also the possibility to procure it over a daily block. On the left side, you can see the awarded prices for each block and in the middle in blue, the total volume procured (either 24h or 4h blocks). The last column is the total daily cost for aFRR downward (capacity price * volume).
The difference between the two months is striking as the total procurement cost is almost 10 times higher in May than in January. This could also refer to the issue of incompressibility that Belgium is going through during the summer11.
aFRR capacity prices in the Netherlands
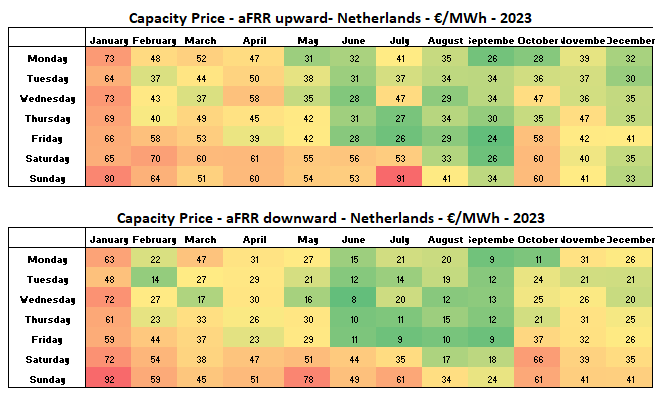
Contrary to Germany and Belgium, the procurement of aFRR capacity is not yet done with 4-hours blocks but is done by blocks of 24h12. The need for increased flexibility during high solar generation is therefore less evident. Nevertheless, we can still observe an increased capacity price as we are moving towards the summer; with increased solar penetration as well as lower demand in general. This is particularly evident in the weekends, and especially Sundays for downward regulation.
In addition, we can observe quite some large difference from negligible prices of 2 €/MW per hour from 3 February to 185 €/MW per hour for Sunday 2 June13. This reflects the large variation in flexibility availability, and therefore prices, depending on the day.
It is interesting to compare these prices to the residual load, calculated as the total load minus the generation from wind and solar. Residual load could be considered as an indicator of the availability of the thermal power plants. Even though the correlation is not perfect, we observe that:
Prices for downward and upward aFRR tend to increase when the residual load decreases.
When residual load is very high, downward aFRR has rock-bottom prices while upward aFRR prices tend to increase. This can be explained by the fact that traditional assets are close to be fully used when residual is high. Therefore, reducing output costs very little, while increasing output is increasingly difficult ast the assets are already fully used.
The tables below present the capacity prices for the year 2023 per month and per day of the week. We observe that during the weekends, when the load is lower, the capacity prices are higher. The solar impact is less clear for the Netherlands due to the procurement of reserves on a 24h block.
aFRR energy prices
Even though the focus of this post is mostly on capacity prices, aFRR does also have an activation component, unlike FCR. For every 15 minutes, all selected bids of the capacity auctions must submit an energy bids, comprised between 15,000 € to -15,000 €/MWh (at least in Germany). The activation of the reserves is done via a merit-order, activating the cheapest for upward activation and the highest one for downward activation. Hereunder are two graphs showing the supply curves14 for three different quarter-hours for downward activation in Germany.
Here is the same graph but with a zoom on prices above -1000 €/MWh.
A few observations from these graphs:
For large activations, prices drop to extremely low prices. Practically, bidders with extreme prices should be activated very seldom, only for large system imbalances.
For small deviations, prices are positive on 19 January while they are negative for 19 May. A negative price means that when the TSO activates the reserve (it is downward, so reducing generation), the TSO will actually pay the reserve provider to lower generation.
These energy prices are important as they influence the imbalance price (more on that topic on a future post). See for example the graph of the imbalance price on 12 May 2024 in Germany. We can observe that imbalance prices are reaching very low level (close to -3000 €/MWh), the consequence of activating ever more expensive downward regulation.
What should you remember?
If you should only remember one message is that the need for flexibility is, in itself, flexible. Indeed, our power systems which are increasingly based on wind and especially solar, will fluctuate permanently between an abundance of flexibility and a relative lack of it. Therefore, any analysis which only focuses on monthly or annual averages risk to miss this increasing important fact that we are constantly switching from a renewables-led power system to a “more traditional” power system. To be clear, that has been one of the recurrent messages of my Substack.
Concerning the power reserves, even including large-scale batteries, their prices will be impacted by the constant shift from low to high flexibility. Storage will compete with traditional assets when renewables are not producing, leading to extremely low prices for power reserves. Nevertheless, this lack of revenues will be compensated when traditional assets would be out of the merit order and prices for flexibility will increase drastically. Similarly to the arrival of duck curves in the day-ahead markets, I expect the introduction of “reversed duck curves” for power reserves, with prices being much higher when the sun is shining.
Going further
It is a much harder task to analyze the power reserves market than the day-ahead markets. Nevertheless, as we are switching to a power systems with an increased penetration of renewables and therefore, an increased need for flexibility, these power reserves will most probably become increasingly important, especially to maximize the total revenues of any assets on the grid (conventional power plants, storage, and renewables).
I started the discussion with FCR, here I jumped into aFRR, and especially on their capacity prices in Germany, Belgium, and the Netherlands but I won’t stop here. In the coming months, I will explore more these topics, including imbalance prices across various countries.
Stay tuned and subscribe to receive new posts and do not hesitate to share this post to your peers. Thanks for reading.
In Belgium, it is 7.5 minutes, but it is planned to change it to 5 minutes.
In general, each country has one TSO, except in Germany, where there are four TSO.
Some countries impose the obligation to some market parties to provide the service. For example, France has recently opened up a market for aFRR capacity.
If you are short on energy in your portfolio, you must pay the imbalance price to the TSO. Inversely, if you are long, the TSO pays you the imbalance price. The imbalance price can either be a single price (Belgium and Germany) or a dual price (a different price if you are long or if you are short).
There is also RR, or Replacement Reserves, in some countries.
Or both, passive balancing and intraday markets.
Most numbers taken are 2023, except for France as aFRR procured just started in June 2024. These values should be considered as indicative only.
See the previous post on Germany: 46% of the production in 2023 occurred within 10% of the time, and 62% within 15% of the time.
It should be noted that it is not the only factor. The total load is also an important factor as what is important is the availability of flexible assets. Higher load means potentially more power plants online. This is reflected in the graph for the Netherlands.
Of course, this should also be allowed by the local TSO.
For more information on the incompressibility, see this presentation of Elia, the Belgian TSO.
In the first publication of the post, all prices for the Netherlands were divided by 4. This error has been rectified.
The demand curve is decided by the local TSO and it is generally completely vertical.


Hello, is there a public source for FCR and aFFR prices in Europe? I’m looking at ENTSOE Transparency platform - they have a dedicated section of the website for this but all the data fields are “n/a”.
Thanks!
What is the trend about FCR、aFRR、mFRR, it seems aFRR will prevail .