In this post, we will delve into the solar capture price in Germany for 2023 and we will offer a glimpse into what to expect in 2024. All the data are based on this public platform.
The seasonal behavior of solar
To begin, let's revisit a fundamental aspect: solar energy exhibits concentration during specific months, a phenomenon especially pronounced in countries situated farther from the Equator. The figure below illustrates the monthly solar generation in Germany over the past five years, highlighting a distinct and robust seasonal pattern. Noteworthy points include:
The generation of the best-performing month is between 8 to 12 times the worst-performing month.
The months of November, December, and January have a combined generation of 5 to 7% of the total yearly generation.
The best-performing month gets 14 to 15% of the total yearly generation.
Consequently, the implication is that lower solar capture values are anticipated to resurface around March or April 2024, aligning with the resurgence of significant solar production during that period.
Solar capture rate in 2023
Similarly to previous posts, we use the notion of solar capture price as defined as the average of the day-ahead prices1 weighted by the solar generation2. This capture price can be compared to the unweighted average of the market price, and the ratio is called the capture rate. A capture rate lower than 100% means that solar captures less than a baseload profile.
For the period 2023, the solar capture price is 72 €/MWh (capture rate of 75%), up to 20 November 20233. This capture rate of 75% can be compared to the Marktwertfaktor considered to be 84% and 83% for 2023 and 2024 respectively in Germany according to the four German TSOs in the calculation of the EEG4.
Hereunder are the monthly values. Two months stand out: May and July, with respectively 54€/MWh (66% capture rate) and 52 €/MWh (67% capture rate) for solar. It should be noted that it also corresponds to the worst months for the value of the import/export balance5.
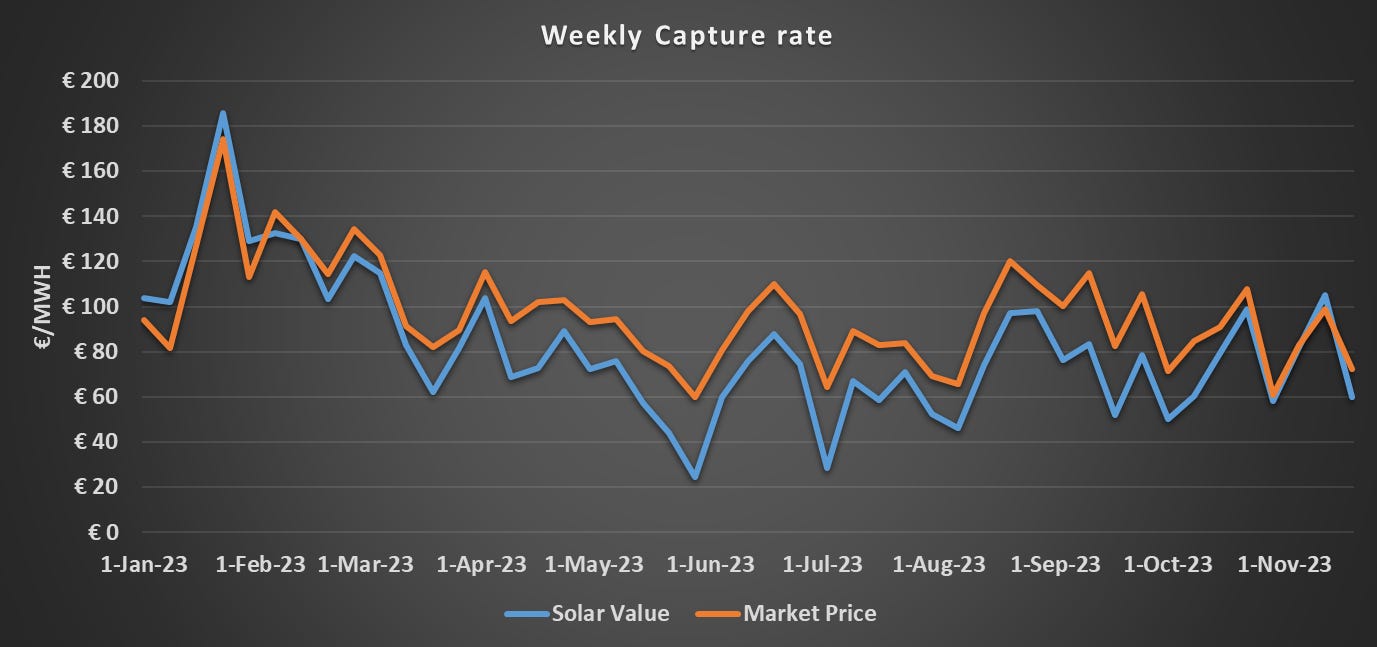
Below is the data for weekly values. Notably, the week of May 28, 2023, stands out as the poorest performer, registering a capture value of 24 €/MWh with a corresponding capture rate of 41%.
Similarly, we can conduct a comparable analysis for each day of the week. Predictably, weekends, particularly Sundays, experience a significant decline in solar capture values. Indeed, the average solar capture value on Sundays throughout 20236 is 26 €/MWh, corresponding to a capture rate of 36%.
Lastly, when examined on an hourly basis, the solar capture values unfold as follows. Combining the insights from the previous two observations, focusing on the afternoon hours of all Sundays (from 10 AM to 4 PM), reveals that the solar capture price stands at a mere 16 €/MWh. This represents only 40% of the average market price for the corresponding hours, with market prices averaging 40 €/MWh during this timeframe.
Added solar capacity
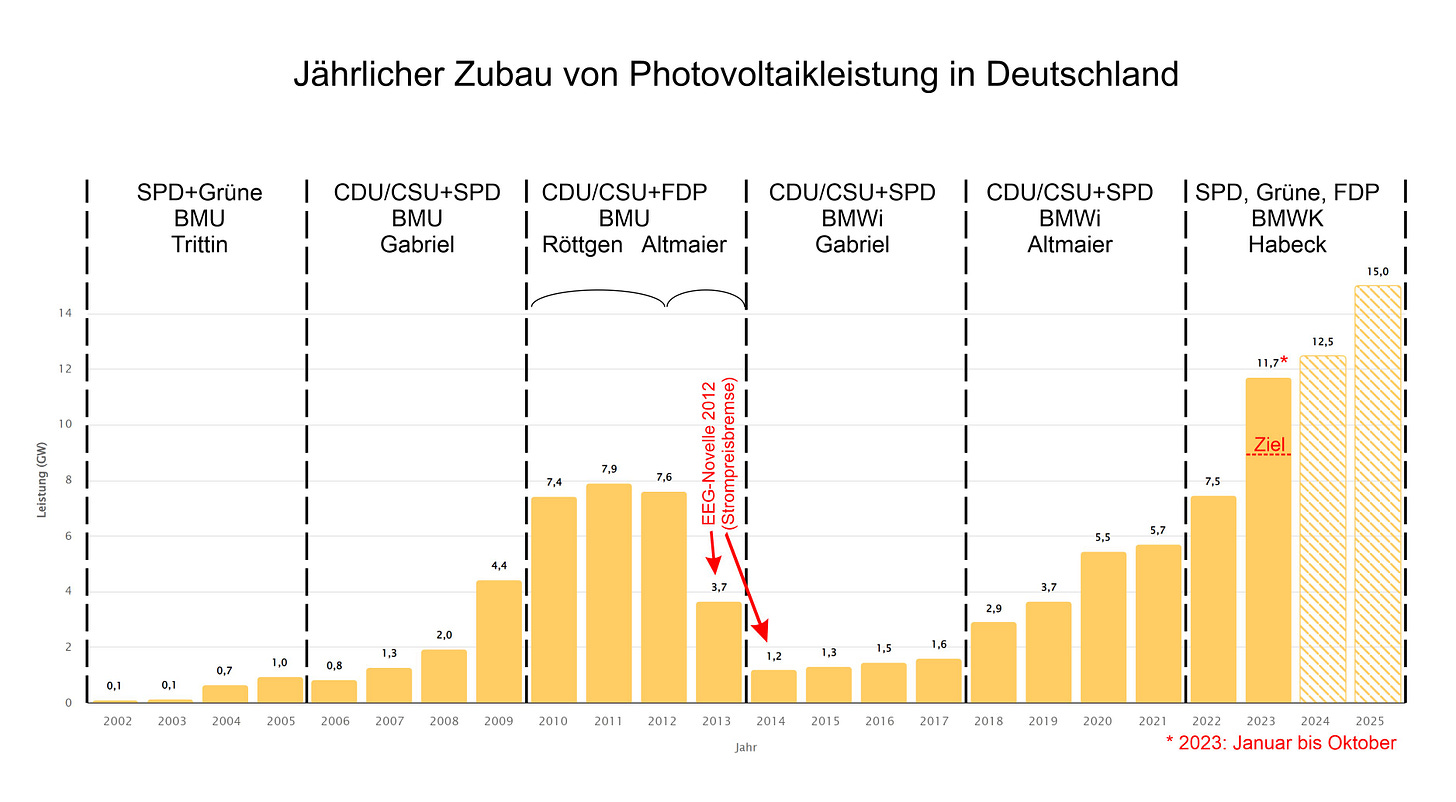
Solar capacity has witnessed significant expansion in Germany throughout 2023, and this growth trajectory is poised to continue in the years ahead. The German government has set an ambitious target of achieving an installed capacity of 215 GW by the conclusion of 2030, marking a threefold increase from the installations recorded at the close of 2022. This delineates a notable acceleration in solar capacity development, with 11.7 GW installed in 2023 from January to October, surpassing the 9 GW objective.
In addition, Germany is not alone and most European countries are following a similar path. In 2023, Europe is set to add 58 GW of solar in 2023. For comparison, Europe installed 40 GW in 2022 and the total installed capacity was 209 GW at the end of 2022.
Capture rates in 2024
Predicting the exact trajectory of capture rates is inherently challenging; however, it appears highly probable that these rates will experience a decline in 2024 compared to 2023. The rapid expansion of solar capacity in Germany and neighboring countries contributes significantly to this expectation. While factors like the proliferation of electric vehicles, advancements in battery technology, and a general uptick in consumption could potentially exert positive influences on capture rates, our perspective suggests that the pace of solar installations currently outpaces the combined impact of these trends7.
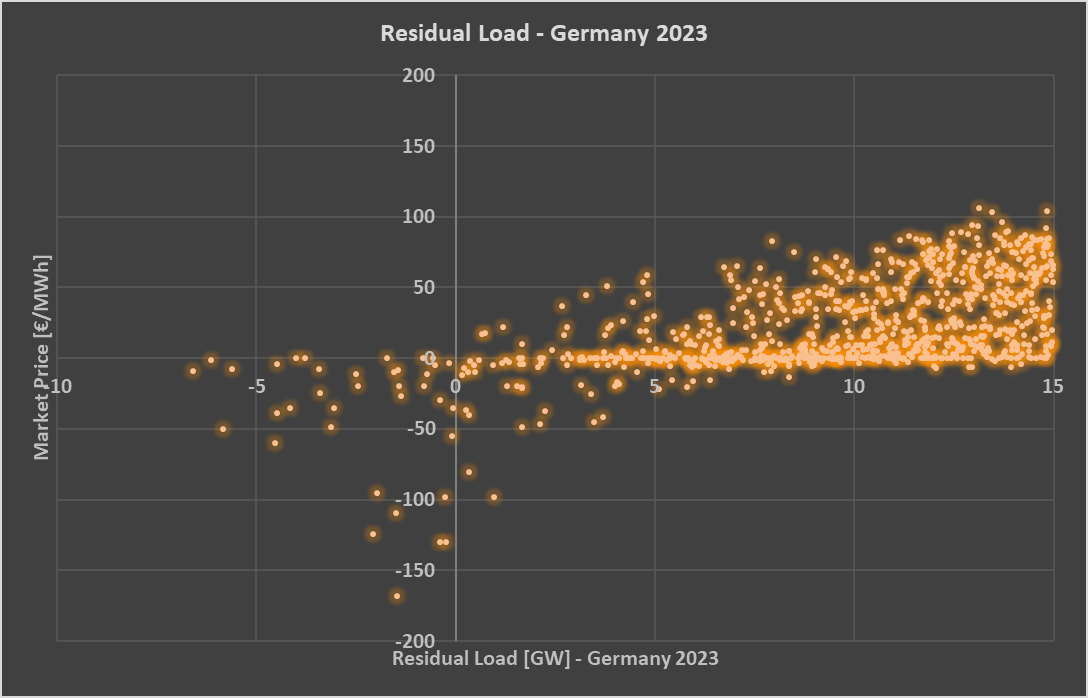
To grasp market prices comprehensively, it is essential to delve into the concept of residual load. This metric represents the total load subtracted by the combined wind and solar generation. When the residual load is low, market prices often experience a significant decline. Notably, in 2023, there were instances where the residual load turned negative, resulting in market prices either hitting zero or going into negative territory.
Indeed, the average market price in Germany exhibited distinctive patterns in 2023 concerning residual loads. For instances with negative residual loads, the average market price hovered around -65 €/MWh. Meanwhile, residual loads ranging from 0 to 5 GW corresponded to an average market price of -1 €/MWh, those between 5 to 10 GW were associated with an average price of 14 €/MWh, and residual loads spanning 10 to 15 GW correlated with an average market price of 35 €/MWh. Adding a substantial amount of solar would undoubtedly lead to lower residual loads.
In conclusion
The penetration of solar energy has undeniably left a discernible mark on market prices, and the ongoing momentum toward solar adoption suggests that this influence is poised to persist. It's crucial to recognize that diminishing capture rates should not be categorically deemed as positive or negative. Indeed, we must maintain a nuanced perspective, acknowledging the fundamental distinction between market prices and the intrinsic value that solar energy brings to the equation8. Nonetheless, it is imperative to acknowledge this effect and formulate appropriate rules and systems to adeptly address these phenomena.9.
Prices of the German bidding zone (DE-LU).
We use hourly values.
It might still change a bit until the end of the year, but unlikely to be drastically different.
See this thread for more details.
From the former post: Zooming in on the year 2023, we observe a fascinating phenomenon. Despite average prices hovering around 80 €/MWh, there were negative capture prices for exports in both May and July 2023.
Up to 20 November 2023.
Check here for further consideration on electric cars and batteries.
Such as the financial contract-for-difference.


Very interesting! How, would you say, does Germany compensate the seasonality effect (chart 1)? With domestic "swing producer" coal or imports (typically French nuclear?)?
Thanks for the article! Are "residual loads" in this context essentially a measure of how abundant renewable supply at any given time is and subsequently displaces all other forms of generation due to having lower marginal costs?
e.g. if you graphed residual load over the hours of the day, would you see it spike in the morning and evening but crater in the middle of the day?