Capture price of imports/exports in Germany
Germany as a study case for understanding capture prices for imports and exports
We have been delving into the intricacies of renewable energy pricing in our previous discussions, with a particular focus on solar energy1. As renewables continue to experience rapid growth in Europe, it's important to recognize that these changes are also making a significant impact on electricity trade balances. Today, we'll take a closer look at the numbers, with a specific focus on Germany. Let's get started.
Merit-order and bidding zones
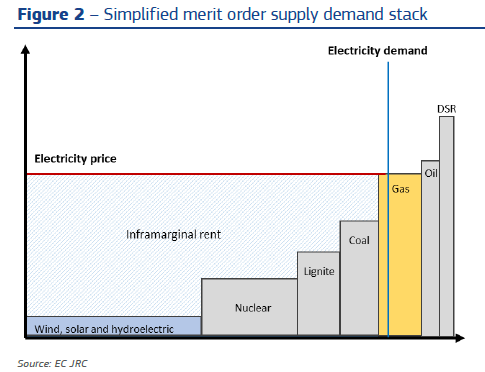
Within the European context, day-ahead markets hold a central position as the benchmark for supply and demand dynamics, aligning these factors on an hourly basis. In this marketplace, each generator submits bids reflective of its marginal cost, thereby forming a supply curve. In parallel, a demand curve emerges, albeit typically displaying greater price inelasticity.
Notably, the marginal costs associated with renewables tend to hover near zero, distinguishing them from other generators that exhibit higher marginal costs, primarily attributed to factors such as fuel expenses, although this is not the sole determinant2. For a general introduction to the merit-order effect, this paper provides some clear insights.
Europe operates on a zonal pricing mechanism, where the continent is partitioned into distinct zones, each subject to a single unified price. Typically, each country corresponds to one zone, with exceptions like the Nordic countries and Italy. Notably, Germany and Luxembourg constitute a single bidding zone. On a daily basis, auctions are conducted for every hour of the upcoming day, establishing the hourly day-ahead prices. Disparities between these zones arise primarily from constraints on transmission capacity, and as a consequence, congestion revenues are collected.

By analyzing the hourly prices in each zone alongside the net position of a specific zone, we can compute the economic value of both imports and exports for each individual hour.
Evolution of the German electricity import/export
Historically, Germany has been a notable electricity exporter. Notably, a discernible seasonal pattern emerges, with the country tending to import more electricity during the summer while ramping up its exports during the winter. The export dominance was particularly evident during the winter of 2021/2022, and intriguingly, it continued throughout every month of 2022. This can be attributed primarily to the prevailing energy crisis, characterized by suboptimal nuclear generation in France and adverse hydrological conditions across Europe3.
Starting from the spring of 2023, we've witnessed a notable shift in Germany's import/export balance, and this transformation can be attributed, at least in part, to the retirement of 4 GW of nuclear power. However, it's essential to recognize that other factors are also at play. To illustrate these changes, the graph below depicts the import/export balance for each month over the past four years.
Trade value and capture prices
As explained above, we can calculate the trade value by leveraging the hourly prices from the day-ahead markets. While it's crucial to acknowledge that electricity is transacted at prices beyond these day-ahead rates, these figures do provide a meaningful gauge of the real-time worth of electricity. Furthermore, this methodology closely aligns with the approach employed in our discussions regarding the solar cannibalization effect. In addition, for additional information on other bidding zones, this website provides some interesting visualization.
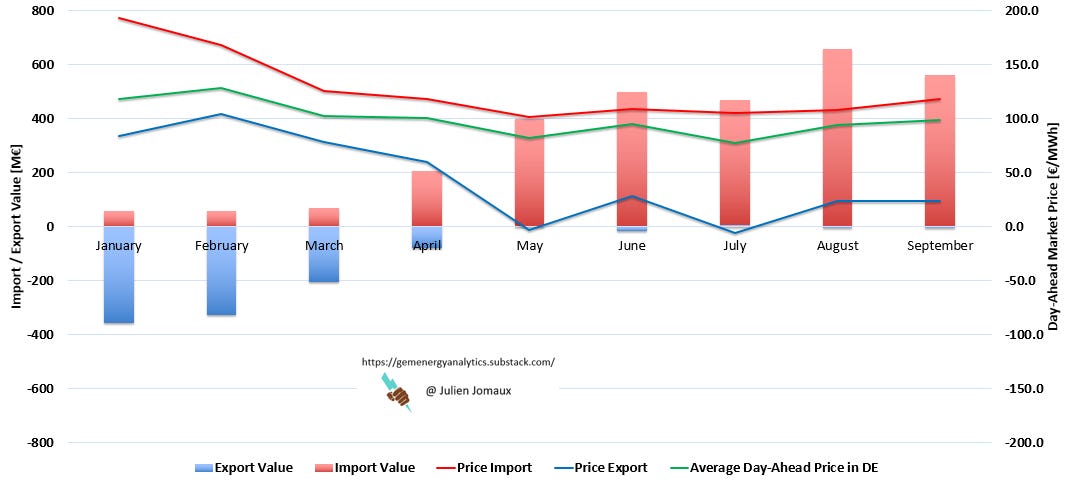
The graph below illustrates the monthly trade value in millions of euros (M€) per month. To determine the capture price of exports, we calculate it by summing the hourly export values and then dividing this sum by the total export quantity. The same computation is applied to imports. For context, we have included the average monthly day-ahead price as a reference point. It's important to note that all market prices used in this analysis are sourced from the German bidding zone.
The impact of the energy crisis is evident when we examine the graph, particularly with the most extreme prices recorded in August 2022.
Zooming in on the year 2023, we observe a fascinating phenomenon. Despite average prices hovering around 80 €/MWh, there were negative capture prices for exports in both May and July 2023. This unique occurrence also transpired in April and May 2020, albeit during a period when average market prices were exceptionally low, primarily due to the COVID-19 situation. In these instances, exporting electricity effectively became a cost rather than a source of revenue.
Even when we exclude the instances of negative monthly average values, one remarkable observation stands out: the capture prices for exports were notably low when compared to the average market prices.
Hourly prices in May 2023
This trend can be attributed to the fact that Germany predominantly exports electricity during periods of high wind and solar production, which typically coincide with times when market prices are at their lowest. This phenomenon directly stems from the cannibalization effect of wind and solar energy.
To illustrate this point, the graph below provides a visual representation of market prices in comparison to Germany's export/import positions alongside France for the month of May 2023. We can clearly observe this correlation: the more Germany imports, the more expensive the market prices are.
Interestingly, in the case of France for the month of May 2023, the situation was the opposite. The country found itself exporting more power when prices were higher.
In conclusion
As the share of wind and solar energy in the energy mix continues to rise, we observe a trend in Germany where renewable exports tend to occur when market prices are low or even negative, while imports take place during periods of scarcity, characterized by high electricity prices.
Given the increasing volatility in market prices, traditional metrics, such as the balance of electricity in terms of GWh, are becoming less meaningful. It prompts us to question the relevance of adding GWh of export and GWh of import when their conventional values fluctuate significantly. This parallel can be drawn to our discussion about the limitations of the Levelized Cost of Energy (LCOE) as a metric in the evolving energy landscape characterized by a high share of wind and solar.
There are many factors concerning the supply bids, and fuel is not the unique one. Other factors are for example: start-up costs, CO2 certificates, etc.


Very interesting and useful, thanks. It will be interesting to see what happened during a colder winter. The difficulty is that it is hard to take any long term lessons as (i) penetration of renewables is moving each year, and (ii) weather a season is unusually hot/cold has a strong influence on imports and exports, and (iii) we're still in the post-Ukraine war disruptions to the system. Do keep on doing this analysis, it is important information.
Thank you for sharing your analysis! In the day-ahead market, what happens when a generator’s bid is accepted, but then they can’t deliver? E.g. thermal generators have mechanical issues or the wind doesn’t blow as much as expected.