


What has been the impact of solar in Europe so far this year? A Mid-May Review

Solar energy is an engaging topic that I enjoy discussing extensively. Solar has truly transformed the energy landscape, particularly in Europe. According to SolarPower Europe, the total installed capacity in the EU reached 338 GW by the end of 2024, matching the spring peak load1. Remarkably, about half of this capacity was installed in just the past three years (2022-2024). Solar now leads as the largest source of electricity capacity in Europe2.
Let's explore some of the impacts we've already observed in 2025 and contemplate the future ahead.
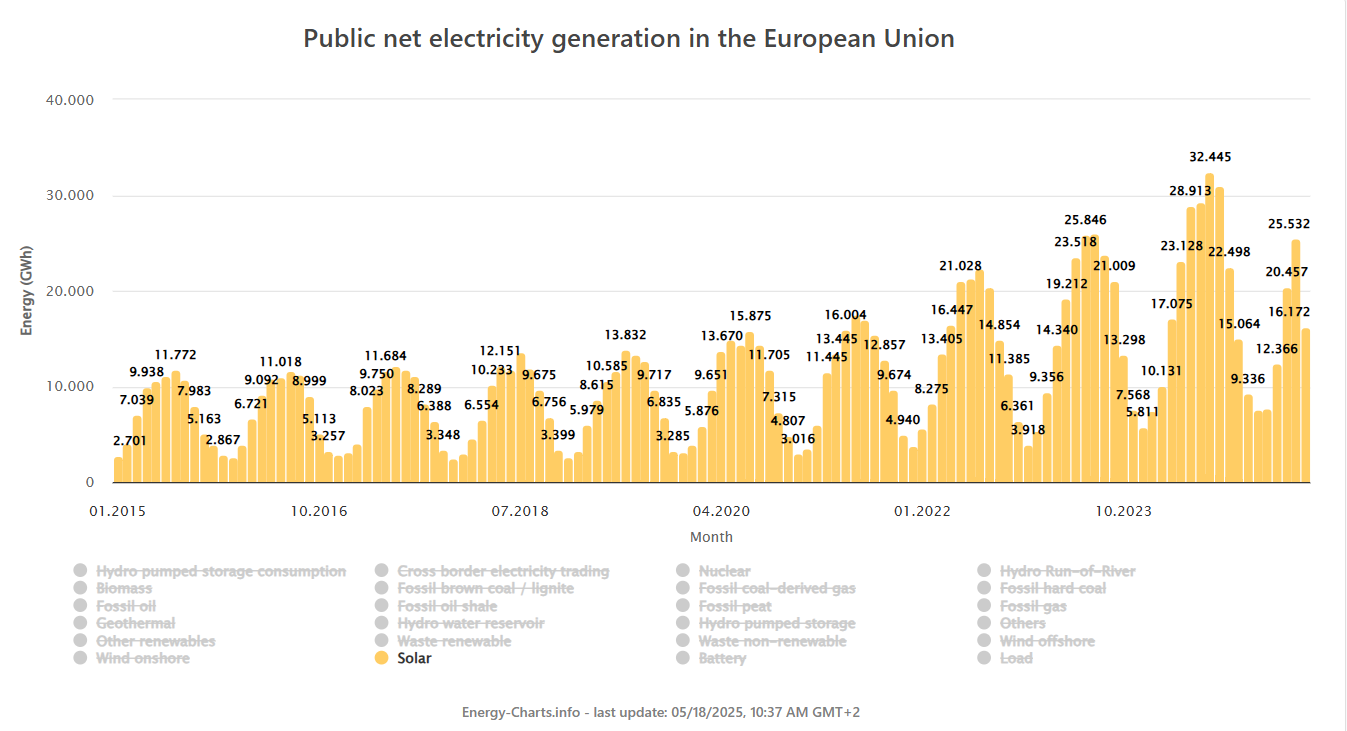
1. How much power from solar was produced so far?
Below is the monthly solar production for the entire European Union. In April 2025, solar production reached 25.3 TWh, nearly matching the highest monthly output of 2023. This clearly demonstrates the significant increase in solar capacity in recent years.
2. Number of negative prices - Belgium
Without any surprise, the number of negative prices has increased this year. As we can see, the year 2024 has been remarkable but this year, the number of negative hours is even higher, even if he had a slower start at there has been no hour with negative prices during this winter after New Year.

Hereunder is the cumulative value of all these hours with negative price. In 2024, the value of negative hours reached -6213 for 404 hours, or an average price of -15.4 €/MWh. This year, we are already at -5119 for 188 hours, or an average price of -27.2 €/MWh, meaning that we have reached larger negative prices this year, compared to 2024.

3. Extreme negative prices
Unsurprisingly, we are witnessing some extreme events in the energy markets3. On Sunday, May 11, there was an occurrence of extreme pricing, with the peak happening at 1 PM, as illustrated in the picture below. The only time prices were lower was on July 2, 2023, when they reached a minimum of -500 €/MWh in Germany, Austria, and the Netherlands.

4. Falling solar value
It's no surprise that solar capture prices and rates are declining. In Germany, the solar capture rate for May (up to the 17th) has been 101%, 86%, 54%, 40%, and even 27%4. The previous record was 49% in May 2024, which is significantly higher than the current rates5. Consequently, “duck curves” or even “canyon curves” are becoming much more pronounced.
Below are the average hourly prices for March 2024 and March 2025. While we see that average prices are generally higher in 2025, there are also a few hours where they were slightly more affordable compared to 2024.

Another approach to assessing solar value is by graphing both solar output and solar value. The solar value is calculated by multiplying solar generation by the day-ahead hourly price. Initially, when solar generation stays below 20 GW, the solar value closely follows the shape of solar generation6. As more solar energy is produced, the value decreases around midday, as prices tend to fall to zero or even turn negative. This trend is particularly noticeable over the last two days, which are weekends with lower demand.

5. Focus on Spain
Last year, I published a post with updates on Spain, mainly because I felt that Spain is really at the forefront of the solar saturation. Spain and Portugal, comprising the Iberian Peninsula, have relatively limited interconnection with the rest of Europe. However, they benefit from some of the highest solar irradiation in Europe, resulting in substantial power generation. Spring poses particular challenges, as the demand for air conditioning hasn't yet begun, leading to lower electricity consumption. During the summer, while solar production remains steady, increased demand, particularly for cooling, generally results in higher prices.7.
Below is the bar chart illustrating day-ahead prices, actual solar capture prices, and solar capture prices assuming full curtailment during negative pricing periods. A sharp decline is evident starting in March. Interestingly, the average day-ahead price, shown in blue, also drops significantly. This is partly due to elevated hydro reservoir levels, forcing hydropower plants to generate instead of store water, thus contributing to an abundant supply in the markets.

When we examine the solar capture rate by curtailing solar generation when prices drop below 0 €/MWh, we observe an improvement. However, this comes at the expense of a reduced volume of solar energy. The graph below illustrates the average solar generation produced when prices are above 0 €/MWh compared to when they are below. Curtailing solar generation at negative prices results in a significantly lower output. Additionally, the solar energy already curtailed for economic or technical reasons is not included in this analysis.

The final graph for Spain 2025 illustrates the occurrence rate of negative prices. As of mid-May, negative prices have occurred for 2 hours. There's a notably high occurrence rate when solar generation is at maximal levels.

Naturally, I couldn't discuss Spain without addressing the event of the year: the blackout in Spain and Portugal. The situation revealed an unexpected number of experts in grid inertia8 and stability. My personal take: let's see what the official investigation concludes.
6. Where is solar in the EU going ?
In their latest Global Market Outlook for Solar Power 2025-2029, SolarPower Europe presented the following graph on the evolution of the newly installed capacity. As we can see the growth has stalled, and the newly installed capacity was only slightly higher in 2024 compared to 2023. For 2025, the organization foresees a similar scenario with 66 GW of new installed capacity. To be fair, this is still an extremely remarkable level of installation, as the load in the afternoon in Spring is below 300 GW for a weekday and below 250 GW on a Sunday.

Unsurprisingly, the organization is alerting on this situation:
At the time of publishing the EMO 2024 last December, SolarPower Europe issued a yellow card to policy makers, warning that if action is not urgently taken to keep supporting its solar industry, the EU is at risk of missing its REPowerEU targets for 750 GW of total solar capacity in 2030. Six months on, we are changing this warning to a red card, as developments in several key markets since the start of 2025 confront us with a more pessimistic outlook. We have once again lowered our expectations, with annual growth staying consistently below 10% for the next 5 years.
In my opinion, maintaining such high levels of solar installations in the coming years would be quite remarkable. Even if solar panels were free, solar projects still incur costs9. I expect economic conditions will worsen before potentially improving, driven by the expansion of battery capacity and flexibility, such as demand shifting. Currently, it appears that the growth in additional solar capacity—around 20% of spring/summer consumption—is (by far) outpacing storage and flexibility efforts. For example, in 2024, new battery capacity reached 21.9 GWh. To effectively absorb solar energy and reduce the occurrence of high negative prices, we will need to increase this capacity significantly.

I anticipate that we will continue to see rising records of negative prices and low capture rates until the balance between new solar capacity and enhanced battery and flexibility shifts. My personal intuition is that both components might evolve simultaneously: a relatively small reduction of new solar installations alongside a sharper increase in battery capacity and flexibility. Of course, this potential slowing down will also greatly depend on the willingness of keeping supporting solar, through various support schemes10.
That concludes my perspective on the future of solar energy, accompanied by insights from the recent months of 2025. Below is a brief update on the German aFRR market, though I realize it appeals to a more niche audience ;-).
Thanks for reading
Julien
7. Bonus chapter: impact on German aFRR capacity market
I have published a recent post on the German aFRR market, here is a quick update of the solar impact on that market.
Below is the chart showing the average German aFRR capacity prices for the 12-16 block (the "solar" hours) for April 2025. The red line represents the average prices for April 2024 at 25 €/MW/h, while the blue line illustrates the much higher average for 2025 at 66 €/MW/h. Notably, on April 29, the average price soared to 291 €/MWh, a stark contrast to 2024 where no single day saw prices exceed 100 €/MW/h.
As you know, during these hours, day-ahead prices are close to zero or negative. This is why prices get higher as traditional providers are either not running or at minimal level already.

Interestingly, when examining other blocks in both upward and downward directions, we noticed elevated prices towards the end of the month, particularly in the 8-12 block on April 30. Additionally, the marginal price hit four digits on April 29, reaching 1593 €/MW/h11.

Naturally, peak solar capacity never reaches 100% generation, even under clear blue skies across Europe.
See data here. There is a notable discrepancy between this source and the figures from SolarPower Europe, which can be attributed to various factors, including a difference in reporting methods. Nonetheless, what is unmistakable is that solar capacity is at the forefront.
Only showing the day-ahead markets.
Meaning that prices are not significantly impacted by solar output.
Here is one of my old paper related to that matter.
See my old post on how cheap solar projects can get.
There are still s significant number of support schemes, where the low solar capture prices are secured by a public entity, most notably the feed-in tariffs in Germany for example. Concerning CfDs that stop payments when prices turn negative, there is an increasing non-negligible volume risk.
The aFRR capacity market is pay-as-bid.
Very good explanation of current conditions. I appreciate your careful analysis and explanations.
Mr Southway, your phrase “this energy policy of using unreliable and parasitic energy” was puzzling. Renewables, as you know are stochastic (& thus not dispatchable). Unreliable? Their MTBF is no worse (or better) than those from conventional generation. Parasitic? How?. A cost wall & creative accounting? Care to expand? As for “the real cost of energy continues to rise” nope – empirically this is not the case and a cursory examination of ENTSO-E data will show. Renewables have lowered real costs of wholesale elec. As my post notes – marginal pricing cannot deliver real wholesale prices when renewables make up a large part of the generation mix. As for putting the continent out of business – correct only in that sticking with marginal pricing in a renewable world will do so. & for the avoidance of doubt, I’m not offering a “point of view” – everything I have said is factually correct and verifiable.