Updates on Spain (as of April 2024)
Negative prices, record level of energy stored in reservoirs and extremely low capture rates for solar
Several intriguing trends have emerged in the Iberian Peninsula recently. While this post primarily concentrates on Spain, similar patterns can be observed in Portugal.
To summarize, 2024 marked a series of firsts, including the occurrence of negative prices on the day-ahead market, a historic peak in energy stored in hydro reservoirs, and extremely low prices recorded, which notably included the capture prices for solar.
Let’s explore together with a few graphs.
Day-ahead Price and solar capture rate
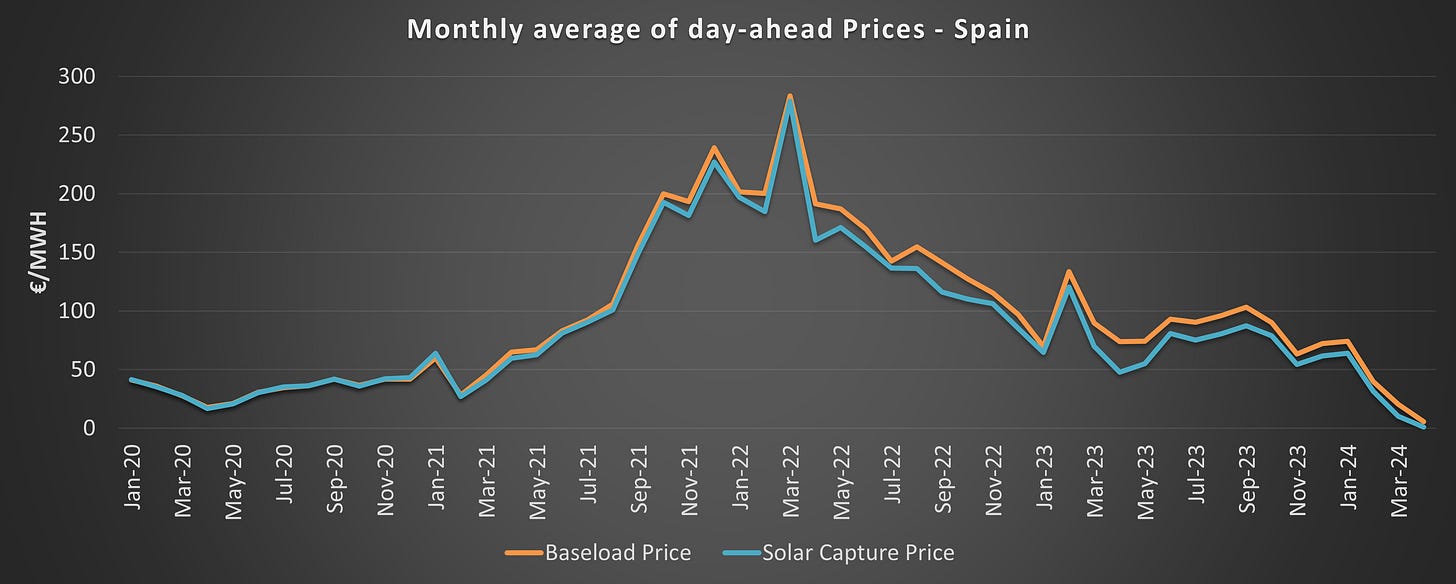
The graph below shows the evolution of the day-ahead price as well as the solar capture price from 2020 to April 20241. We can observe clearly the impact of the energy crisis that started in 2021 as well as the progressive decorrelation between the baseload price and the solar capture price2.
Hereunder is a zoom on 2023 and 2024. As we described in an earlier post, the impact of solar is mostly felt during the shoulder months3.
By considering the monthly relative value, or the solar capture rate4, we see a first deterioration last year in March to May with values below 80% but nothing compared to this current year, when the capture rate has dropped to 50% in March and even 20% in April. Of course, these capture rates are based on extremely low level of baseload prices, which means that all technologies have experiences rock-bottom capture prices. Indeed, monthly day-ahead prices have been 20 and 6 €/MWh for March and April5 respectively.
The duck curves in 2024
If we look at the hourly average prices for each month, we can see that the duck curve is being flattened dramatically. Virtually, all solar production hours are happening when prices are close to zero, translating into the results shown above: solar capture rate is 20% on a baseload price of 6 €/MWh6.
Historic level of energy stored in reservoirs
One of the explanation for these extremely low prices is the historic level of energy stored in the Spanish hydro reservoirs7. On week 15 of 2024, the stored energy was above 14 TWh, a level never observed for the last 10 years. This energy corresponds to approximately three weeks of electricity consumption.
The very low day-ahead prices when hydro must produce are not unique to Spain. Similar situations can be observed in Northern countries for example such as Norway and Sweden. I explored the capability of seasonal storage by hydropower in this post.
First-time with negative prices on day-ahead markets
Additionally, Spain has experienced negative pricing for the first time. This initially occurred on April 1, 2024, when the price dropped to -0.01 €/MWh. Since then, until April 21, there have been 96 hours of negative pricing, with the lowest recorded at -1.5 €/MWh on the last day.
However, it's worth noting that Spain is unlikely to see extensive negative prices. This is due to the supply curve's flatness around the 0 €/MWh mark, as demonstrated below. Over 20 GW are offered within a narrow price range of -5 to 0 €/MWh
This is very different from other European countries such as Germany where the supply curves during sunny hours are very rapidly dropping to extremely low levels, reflecting the fact that a large quantity of solar is not stopped when prices are negative, a feature that I presented in this earlier post.

A last word
Spain is an interesting case as it is relatively isolated from the rest of Europe. The potential for green energy, either wind and solar, in the Iberian peninsula is particularly good due to a number of factors such as, for example, a lower population density outside of major cities and a good solar irradiation. This is not surprising that future prices of electricity in Spain are trading with a large discount compared to other European countries8. This could make Spain, as well as Portugal, an advantageous location for energy-intensive industries and in particular, green hydrogen production.
Until 21 April 2024.
In Spain, we can consider March to May, as well as September and October.
Solar capture rate is the ratio between the solar capture price and the average price (baseload price).
Until 21 April 2024.
The value for April is currently 1.13 €/MWh exactly.
This is also observed in Portugal with an energy stored above 3 TWh.
On 19 April, calendar year 2025 was trading at 62 €/MWh in Spain and 90 €/MWh in Germany.


Really informative and interesting as always. Thank you!
interesting charts!! How would wind captured rates and PPA prices evolve in Spain for the next years? Which levels would be realistic?