Impact of solar on electricity prices: focus on Germany and Spain
Various elements to understand how and when solar has an impact on market prices
In this post, we will go through several aspects of solar to understand how and when it impacts electricity prices with a special focus on Germany and Spain. This analysis aims not for exhaustive coverage but to furnish essential elements that enhance comprehension of solar's influence on electricity market prices1.
We have already introduced this topic in these earlier posts:
Let’s dive in.
Why do we need to care about solar?
Solar power is experiencing a rapid surge in growth, as evidenced by multiple reports. The EU outlook for 2023-2027, recently published by SolarPower Europe, underscores a distinctly positive trend for the solar industry. From the report:
In absolute terms, new additions between 2024 and 2027 will contribute 313 GW, bringing up total installed PV capacity to 576 GW by the end of 2027, according to the Medium Scenario. This means a 119% increase of the EU solar power generation fleet within four years from the 263 GW in operation end of 2023.
Even though these values are DC-values2, they are truly remarkable when juxtaposed with the EU load during the peak solar months, spanning from April to October. Typically, the average load in the EU ranges between 270 to 300 GW during the sunlit hours of these months. Remarkably, solar capacity, expressed in DC value, is poised to surpass the average load for these months as early as 2024.

The anticipated growth in solar power is not confined to Europe; it extends globally. According to the International Energy Agency (IEA), their primary projection foresees an addition of 1525 GW and 1140 GW in new capacity for utility solar and distributed solar, respectively, between 2023 and 2028. This marks a substantial increase compared to the preceding period (2017-2022), which saw only 502 GW and 366 GW added for utility solar and distributed solar, respectively
Why does solar impact market prices?
An essential aspect to grasp is the formation of market prices, particularly in Europe where the pivotal mechanism is the day-ahead market. Each day, an auction is conducted to establish hourly prices for the following day, with the continent segmented into zones due to interconnection constraints.
These auctions hinge on the intersection of demand and supply curves. The supply curve is a compilation of prices offered by generators, determined by the marginal costs of their assets. Notably, renewables like solar and wind, with near-zero marginal costs, exert downward pressure on prices as their presence increases in the market.
When do (very) low prices appear?
As market prices are determined by the highest bid selected, wind and solar, with their near-zero marginal costs, contribute to lowering market prices. On the other hand, large hydro, dependent on the opportunity cost of water, and nuclear, which may employ complex bidding strategies, introduce additional dynamics. Fossil fuel generators typically incur marginal costs primarily tied to fuel and carbon expenses. While this explanation provides a simplified overview, it is crucial to acknowledge that in reality, various factors may influence bidding strategies and, consequently, the ultimate market prices.
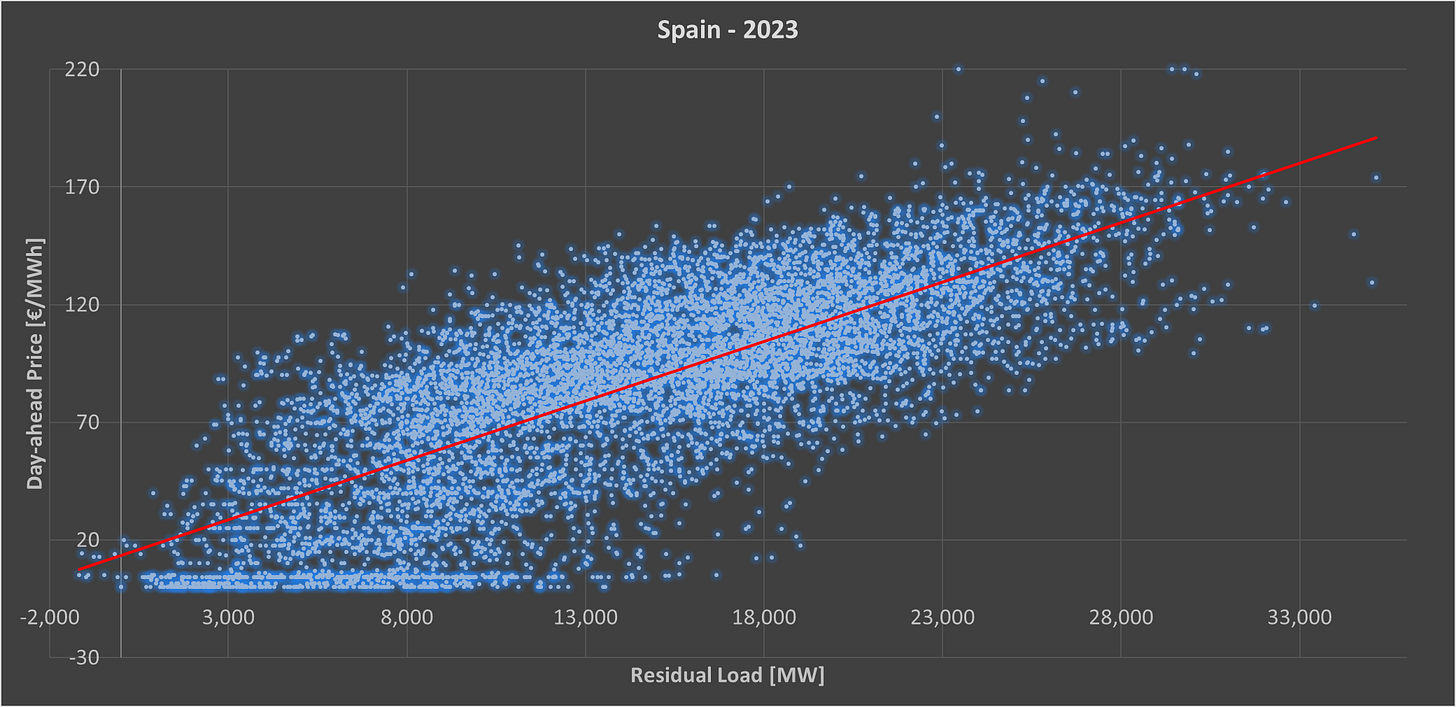
Considering these factors, a robust correlation emerges between the residual load and the ultimate market price. The residual load is defined as the load minus the contributions from wind and solar sources.
In the graph below3, we present the relationship for Germany in 2023, the largest bidding zone in Europe. One point is one hour of the year. The X-axis is the residual load of that hour and the Y-axis is the hourly price on the day-ahead market.
For Spain, the relationship between residual load and day-ahead price is relatively strong as well. For both countries, we observed hours with negative residual load, meaning that wind and solar were covering more than the actual demand.
Solar distribution and market prices - Germany
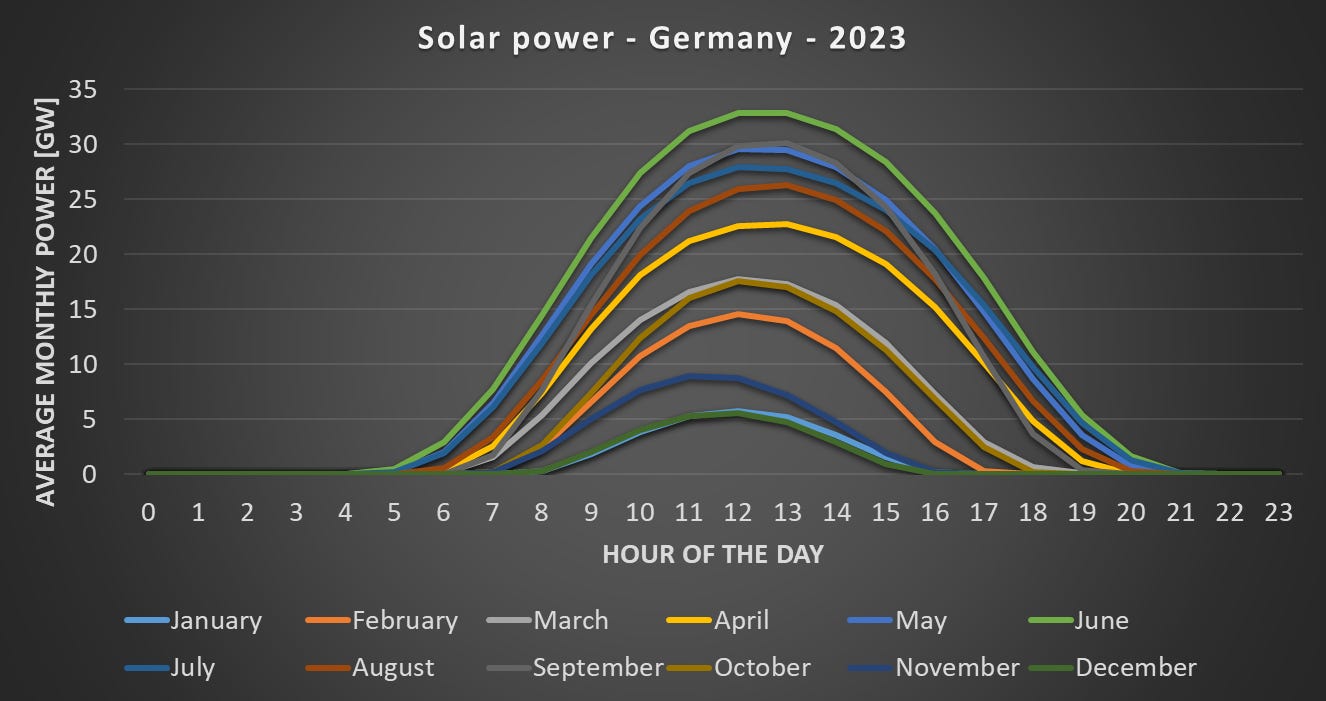
Now, let’s look at how solar power is distributed over the year. Here we present the result for Germany in 20234. The graph below illustrates the average hourly distribution by month. Notably, the months of December and January exhibit lower solar power generation, with a noticeable improvement observed already in February. However, substantial generation levels are consistently achieved only from April to September.
Upon aggregating the monthly generation levels, the resulting distribution is presented below. Remarkably, the most prolific month, July, surpasses the output of the least productive month by approximately ninefold, underscoring the significant variability at these latitudes.
This production pattern is mirrored in market prices, as illustrated in the graph below depicting the average day-ahead market prices from April to September. The influence of solar power is evident, with market prices generally lower during the sunlit hours, forming the characteristic 'duck curves'.
When focusing on the day of the week with the lowest demand, namely Sundays, the impact on market prices becomes even more pronounced. It is important to note that the averaging of market prices on Sundays within a given month is based on only 4 or 5 data points. Notably, July stood out, largely due to a specific event on Sunday, July 2, when prices plummeted to a minimum value of -500 €/MWh.
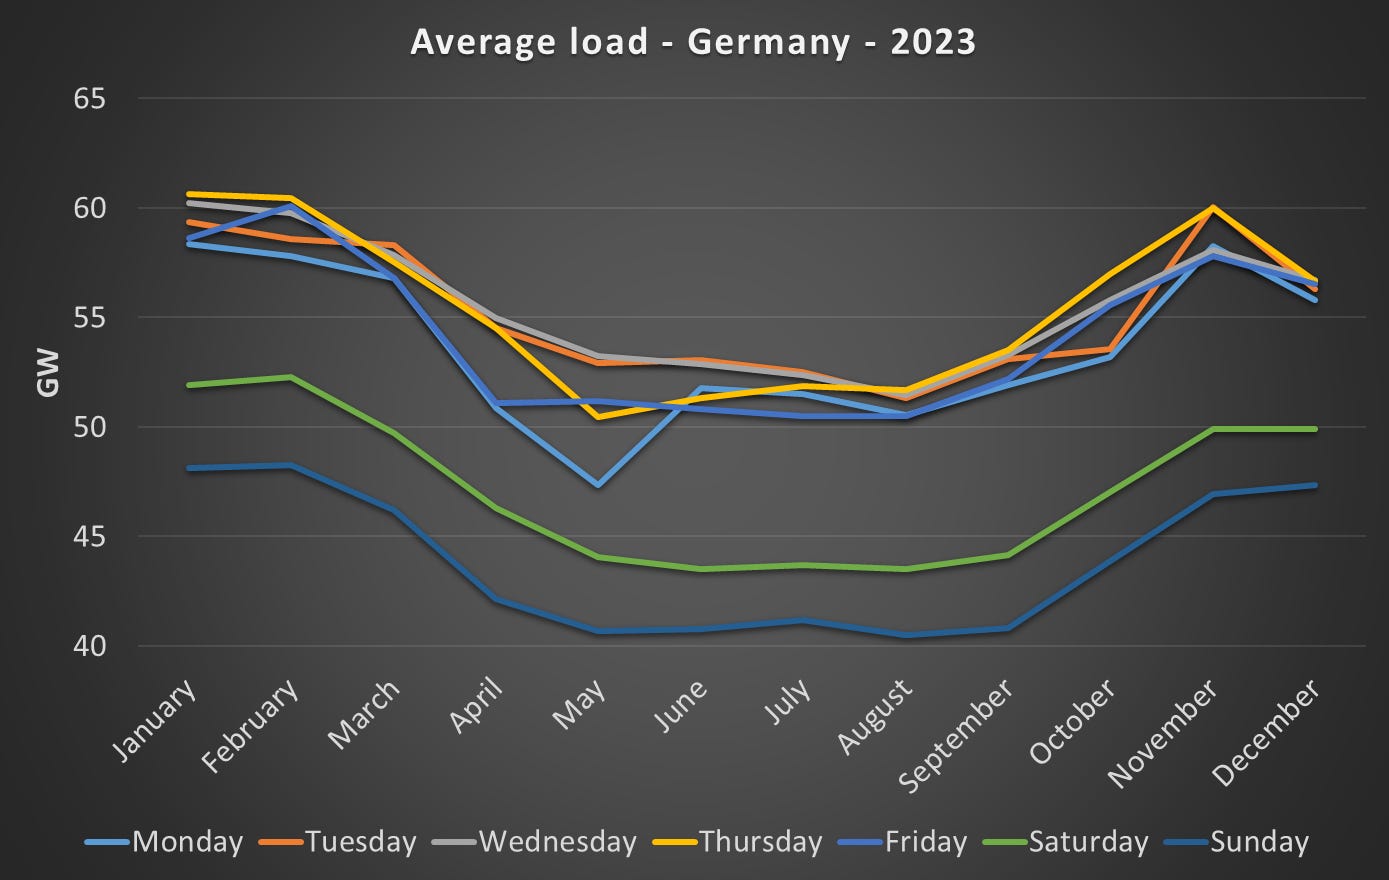
The reduced prices observed during weekends can be attributed to lower demand, resulting in a comparatively lower residual load for a similar renewable output. The graph below illustrates the distribution of load in Germany per month based on the day of the week. A distinct pattern emerges, revealing lower loads during weekends, with Saturdays and Sundays representing 86% and 80% of the load observed on weekdays, respectively. Additionally, the graph highlights the seasonal variation, with higher loads in winter compared to the summer months.
In addition, the reduction of the overall demand following the energy crisis is allowing solar to be more impactful. The total load was 457 TWh in 2023, a reduction of 5.4% compared to 2022 (483 TWh).
Solar distribution and market prices - Spain
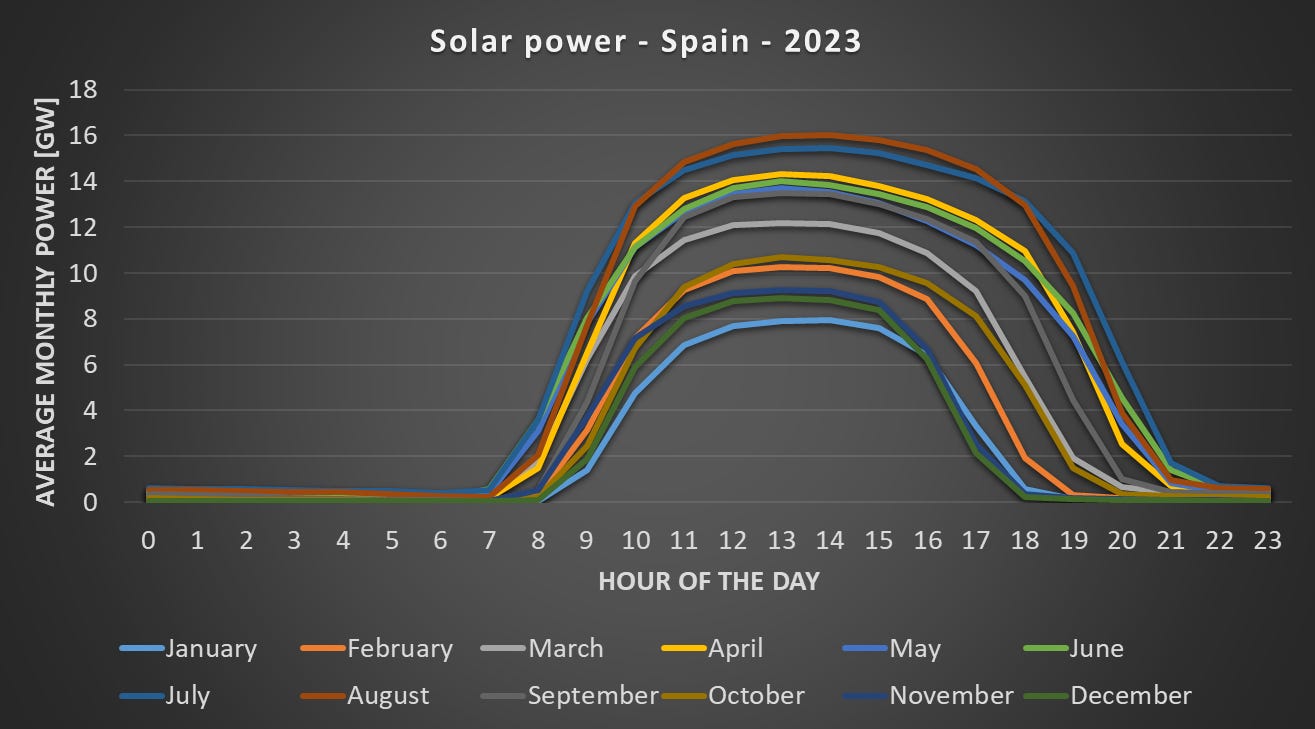
Spain5 exhibits a quite different pattern than Germany. Indeed, the top of the curves is relatively flat, which can be potentially explained by different factors such as a higher share of utility-scale projects with oversizing specifications6 or more solar curtailment at a high generation level7. Also, interestingly, solar generation is never zero as Spain has some concentrating solar plants.
As a result, the monthly totals vary significantly between Spain and Germany. From April to September, solar generation in Spain averaged around 4 TWh per month, with July and August showing a slight improvement. Notably, the highest-performing month in Spain produces only three times more than the least productive month, in contrast to the ninefold difference observed in Germany.
Regarding market prices, a discernible impact is evident, as illustrated below. April and May, in particular, experienced a pronounced effect with lower prices.
When focusing specifically on Sundays, the impact becomes even more pronounced. It is worth noting that the Spanish day-ahead market does not exhibit negative prices.
Examining the average load, we observe that weekends, particularly Sundays, register lower demand. However, the monthly distribution differs from Germany, with loads maintaining a relatively consistent level akin to winter demand. Only during mid-seasons do we observe lower loads. The higher summer loads might contribute to solar production being more pronounced during this period, possibly due to reduced curtailment (assumption to be verified).
It's worth noting that SolarPower Europe has already identified potential limitations for further growth in Spain:
Although Spain maintains its position as the second-largest solar market, we have significantly revised downwards our solar projections compared to the GMO 2023. The country is now foreseen to connect 46.6 GW until 2027, which is 26% less than the June 2023 expectations. Challenges in the self-consumption segment, delays in processing of permits, grid constraints and most importantly, the threat of lower solar capture prices in the absence of appropriate flexibility deployment, have led us to this more cautious outlook.
Relativizing the impact
With solar capacity anticipated to double in the EU within just 4 years, it is evident that the impact on electricity markets will be substantial. While this post concentrated exclusively on the day-ahead market, which serves as the backbone of European power markets, it's crucial to recognize that the influence of solar will extend to other facets of the electricity markets, as illustrated in the following post on the impact of a sunny day on aFRR.
Nevertheless, as Niels Bohr said: “Prediction is very difficult, especially if it's about the future.”, there are significant unknowns that make any long-term forecast of the impact of solar on market prices quite tricky such as:
The emergence of batteries is a crucial factor. With cheaper batteries on the horizon, there's the potential to mitigate the 'duck curve' and absorb a portion of the surplus energy. However, it's essential to note that batteries are not well-suited to address the summer/winter variations in Germany.
Demand flexibility. Across the EU, demand is going to be more flexible as dynamic tariffs are being introduced and smart meters are rolled out. See this earlier post.
Increased demand. The decarbonization process requires an increased electrification of our energy needs such as electric vehicles and heating.
Nevertheless, we believe that the acceleration of solar power is outpacing the combined influence of these elements, at least for the coming years. As highlighted in a previous post, the potential impact on market prices could potentially serve as an important limiting factor for the continuous, rapid expansion of solar power, at least until other trends come into play.
We focus in this post on the day-ahead market, the cornerstone of the European electricity markets.
AC values (after the inverter) might well be lower due to oversizing, i.e. installing more solar capacity than the rating of the inverter.
Oversizing is the concept of installing more solar panels than your inverter is rated for.
Please share your view on the question if you have more info on that matter.


Love the graphics. Very informative.
Great charts! Thank you Julien!