Where to find the cheap and the expensive power in Europe this year so far?
Analyzing the evolution of electricity prices in 2024 in various parts of the European grid
In this post, we’ll explore electricity prices across Europe, examining where costs are low and where they’re high for 2024 so far. As you’ll see, there’s no simple answer—it varies depending on the time of day and the bidding zone. As always, electricity prices hinge on timing and location.
To uncover the trends, I’ll present graphs showing price evolution throughout 2024, using 30-day rolling averages focusing on specific hours of the day. I’ve selected several countries for this analysis: the four largest EU economies (Germany, France, Italy, and Spain), along with Poland, Hungary, and Finland. While I could have included more, the post is already quite long.
With four months of 2024 still ahead, further developments could be interesting to observe. In addition, there are probably many things to write that I omitted. My objective was not to be exhaustive but to present some trends that I found interesting.
Let’s explore.
Pay attention to the Y-axis. It is different from one graph to another (while the X-axis remains the same).
What are we looking at?
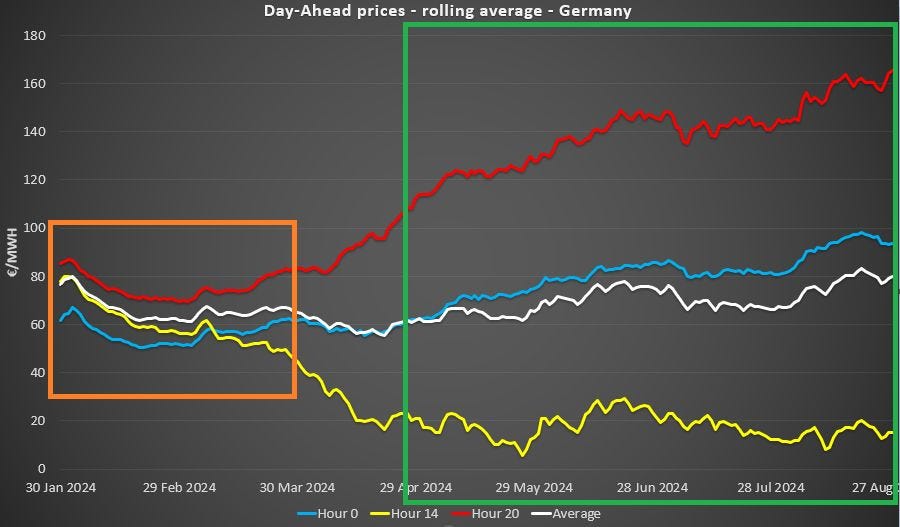
The graphs presented here display 30-day rolling averages for four key parameters:
The 8 PM hour in red, generally represents the highest prices due to peak consumption and lack of solar generation.
The 2 PM hour in yellow, represents peak solar generation.
The midnight hour in blue represents off-peak nighttime prices.
The average of all hours (daily average) in white.
These hours reflect distinct categories, so their price trends vary throughout the year. In winter, solar generation is nearly nonexistent, and prices tend to cluster closely together with limited spreads. As we move into spring, prices during the solar hour begin to drop, while nighttime prices remain relatively stable.
For peak hours, a major factor influencing prices is the cost of natural gas, as it often sets the marginal price during these times. The price of natural gas decreased from €30-35/MWh at the beginning of 2024 to slightly below €25/MWh in March, before rising again to around €40/MWh recently. Considering a gas power plant efficiency of 40%, the cost of producing electricity from gas is currently about €100/MWh. Additionally, the cost of carbon permits, which is approximately €30/MWh for natural gas1, must be factored in.
However, this theoretical price of €130/MWh2 is often significantly exceeded, particularly after winter ends. This phenomenon is partly due to the reduced operation of flexible generation units in the afternoon, as solar power dominates during these hours. Consequently, when the evening ramp-up begins, flexible generators incorporate start-up costs and higher ramp-up costs, leading to spikes in peak power prices on certain days. For instance, in Germany, the maximum price at 8 PM was €120/MWh in January and February 2024 but surged to €257/MWh on July 8, 2024. This effect has been even more pronounced in Eastern Europe, as shown below for Poland and especially Hungary.
Furthermore, limitations in the transmission export capacity can have a significant impact on the prices in Europe3.
Germany - the rise of cheap and expensive power
The largest bidding zone in Europe experienced two distinct phases:
Orange Box: Winter — During winter, prices across the three referenced hours were relatively close, with the midnight hour generally being the cheapest.
Green Box: Spring/Summer — Peak prices increased steadily, perfectly illustrating the phenomena discussed earlier.
The growing disparity between peak solar prices and peak or average prices underscores much of the current debate around low solar capture prices, the need to enhance demand flexibility, and the imperative to make renewables more responsive to market signals.
When we focus on the 8 PM hour, the trend of more extreme prices during spring and summer becomes evident. Relying solely on natural gas prices with a 40% efficiency and a specific CO2 cost as a proxy, we still fall short—by as much as €100/MWh—of fully explaining these peak price levels. Very recently, on 3 September, the price at 7 PM has even reached 656 €/MWh.
At 2 PM, prices can reach up to €90/MWh even in spring and summer, highlighting the obvious: it isn’t always sunny in Germany or Europe in general. Significant negative prices also play a major role in pulling down the rolling average, but this effect isn’t seen across all European countries, as large negative prices do not occur everywhere.
France - Limited peak prices
Following some of the most challenging years for nuclear production, France has now become a major power exporter, as evidenced by its lower electricity prices compared to neighboring countries.
Interestingly, until March, prices in France were quite similar to those in Germany. However, as shown in the graph below, peak power prices in Germany began to rise, while in France they declined. France is generally less affected by rising peak-hour prices due to its unique generation mix of nuclear and hydropower4. Notably, the solar hour remains consistently cheaper in France than in Germany (based on the 30-day rolling average), despite France having significantly less installed solar capacity. This can be attributed to several factors, one of which is likely its proximity to Spain.
Focusing on the 8 PM hour, we can see that France’s peak prices are notably more restrained compared to Germany. While peak prices in Germany can exceed €200/MWh, they rarely surpass €120/MWh in France. This significantly lowers the rolling average, preventing it from reaching the higher levels observed in Germany.
Spain - the V-curve
Spain's position as a Southern European country is clearly reflected in the evolution of its power prices:
During the solar hour (2 PM), prices are low even in winter and drop to rock-bottom levels in spring (blue box), resulting in extremely low capture prices for Spanish solar.
All power prices rise in summer (red box) due to increased demand driven by higher temperatures. This broad increase in prices is more pronounced in Southern Europe.
Spring was particularly noteworthy, as energy stored in hydro reservoirs reached historic levels5 (still at historic highs for this time of year), driving prices close to zero as seen in the rolling average nearing zero by the end of April. This phenomenon is also observed in Nordic countries, like Finland, although there, the highest energy storage levels typically occur at the end of summer6.
Examining the 8 PM prices, we see that in April, even peak prices dropped significantly, resulting in an average price of just €13.67/MWh for the month. Prices gradually increased afterward as demand rose and water reserves were depleted.
For the 2 PM hours, prices were frequently near zero in March, April, and May. Interestingly, in summer, 2 PM prices can vary widely—ranging from nearly €90/MWh to very low levels. Prices tend to be low when solar generation is high and demand is low (e.g., on weekends) or when there is significant wind generation.
Italy - the Southern land without much solar
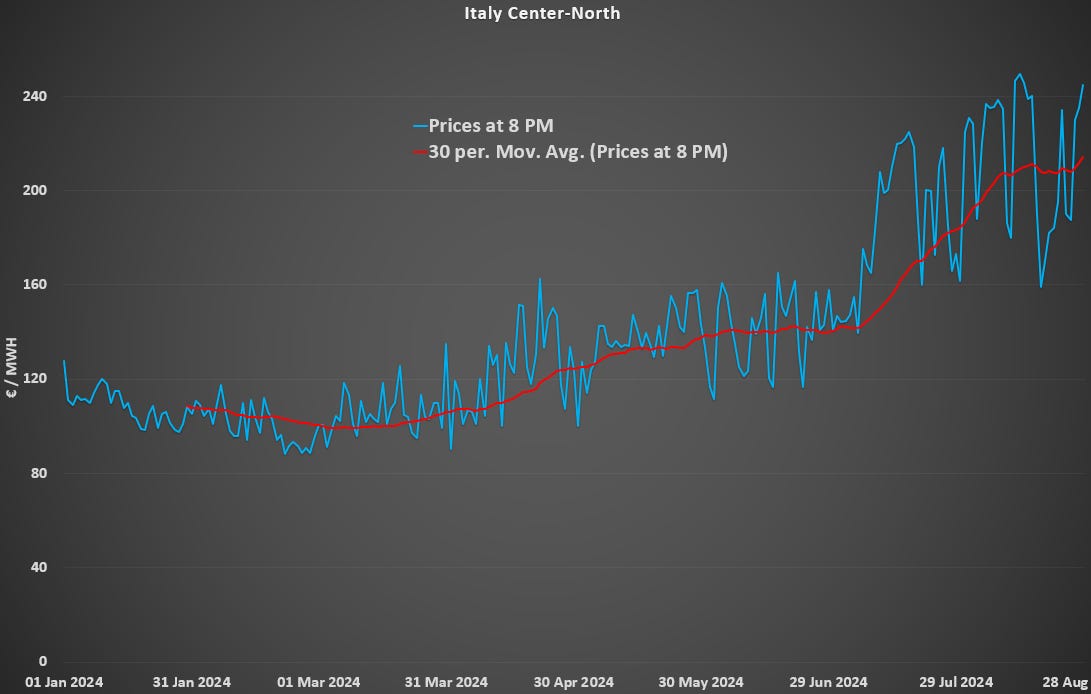
Italy, while also a Southern country, differs significantly from Spain. Unlike Spain, Italy has not expanded its solar capacity to the same extent, which is reflected in its power prices. Additionally, Italy relies heavily on gas for power generation.
Like other economies, peak power prices in Italy have risen significantly, occasionally exceeding €250/MWh on some days.
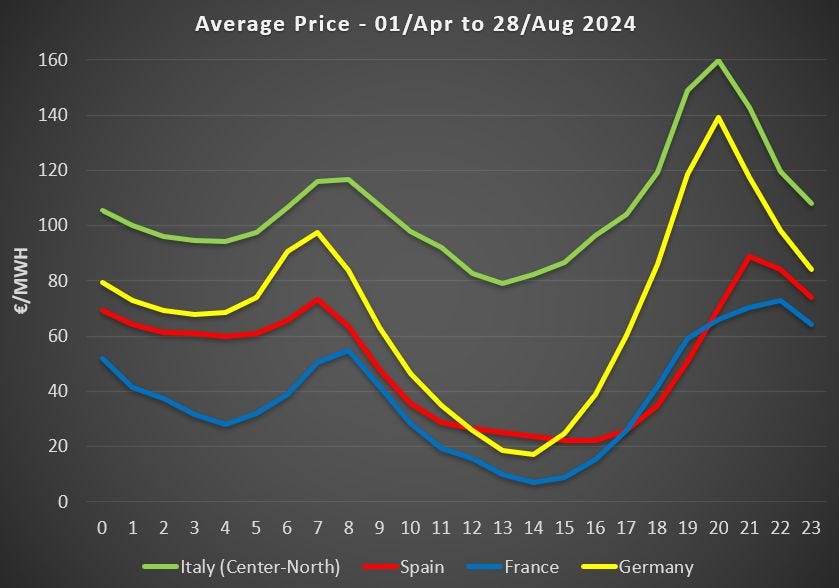
Compared to the previous three countries, Italy still has significant potential for expanding its solar capacity. Despite having favorable solar capture rates, as shown in the graph below, Italy's average prices from April to August 2024 remain higher during the afternoon than those of the three other major European economies, even though it is a sunny country.
Hungary - the price explosion
Hungary presents an intriguing case, as prices have surged dramatically during the evening. Winter (orange box) was relatively stable, but in spring (blue box), the pricing behavior was similar to Germany's. However, during the summer, peak prices escalated to crisis levels. This surge is attributable to several factors, including a heatwave in Eastern Europe, reduced transmission capacity, and the unavailability of certain power plants7.
The graph below clearly illustrates this price explosion, with the peak reaching an unprecedented €999/MWh on July 18, 2024. Such an exceptionally high price level cannot be solely explained by the costs of natural gas and carbon permits
Poland - solar is making its way
Hereunder is the graph for Poland. Even though solar is still relatively limited in Poland compared to neighboring countries, we can observe that solar is making its way. We can also observe some increased stress at peak hours in the summer.
Finland - from the top to the bottom
In Finland, and more broadly in some Nordic regions, prices have been declining steadily. This trend is partly due to the significant presence of hydropower with reservoirs, which helps stabilize prices when water levels are high, as they are during the summer.
All countries at 8 PM
Prices at 8 PM can vary significantly from one country to another. Here are a few key observations:
Price divergence is notably greater in summer compared to winter.
Italy generally experiences some of the highest prices.
Peak prices have surged in several Eastern European countries, with ripple effects in neighboring regions.
France has managed to keep peak prices relatively low throughout the year.
Recently, Finland has experienced very low peak prices.
All countries at 2 PM
Observations for the 2 PM hour are as follows:
Italy consistently has the highest prices. As a Southern country, this indicates that its solar potential has not yet been fully utilized.
Southern countries like Spain typically experience lower prices earlier in the day, with prices rising in summer. This pattern reflects consumption trends related to temperature variations.
Prices at 2 PM are generally much lower in spring and summer across most countries. This is especially evident in France, where the rolling average has been below €20/MWh since April. Germany’s prices are slightly higher but remain close to France’s levels..
All countries - average
So, where should you go to benefit from cheap prices? It depends on the time of year:
Winter: prices are relatively similar across countries.
Late Winter to Mid-Spring: Spain offers substantially cheaper prices during this period.
Spring and Summer: France becomes an attractive option for lower prices.
Summer: Finland offers exceptionally low prices.
Other Considerations: except for instances where prices spiked in countries like Hungary, Italy, and Poland generally have higher prices.
As we promote demand flexibility, including for industrial loads, could it be that achieving demand flexibility also requires increasing production output in specific countries based on the time of year? Or is this unrealistic due to various other factors, such as workforce availability, tax regimes, and other constraints? Alternatively, could highly automated processes be implemented relatively inexpensively to capture price variations between countries? To be honest, it seems difficult as it would require an increase in industrial capacity and a lower utilization rate of this capacity, which represents a cost in fine. Nevertheless, we could maybe find some niche applications where it could be possible.
Of course, it depends on the price of the carbon permits as well as the efficiency of the power plant.
Theoretical in the sense that it greatly simplifies the reality.


Very interesting analysis. I would really like to see a similar analysis for different grids within the United States.
I think that it is also very important to add that Western Europe has by far the most expensive electricity prices in the world (along with small island nations). USA has an average price of 16.2 cents per kWh. For comparison, you can see here:
https://www.globalpetrolprices.com/electricity_prices/
Very interesting analysis.
Not discussed is the importance, or lack thereof of day ahead. In France, day-ahead accounts for perhaps 3% of overall market volume, by contrast, in Spain, day-ahead is circa 75% (market volume) - both numbers come for the French and Spanish regulators (2021) - might be a bit out of date - but you get the idea. Germany is a bit of a mix forward markets and day-ahead. Thus the problem is: what are we really looking at? It is possible to get an idea in France - day-ahead is mostly irrelevant - it is the forward markets (weeks, months, years) that count. Set against that, day-ahead in Spain gives a good view - & it is likely that day-ahead France vs day-ahead Spain drives the x-border back and forth (mostly in the favour of the French btw)
One question not answered: sunny place Spain - when its hot (& thus high a/c/ demand) it is usually sunny. Is it beyond the wit of man or markets to deliver a localised solution (some pv-powered a/c plus cold storage for use when the sun goes down). Given the realities of Spanish power demand - with peaky prices this would spoint to a gross market failure ("markets driving innovation" & similar utopian fantasies). In the case of France, the nuke - hydro dynamic is something of a problem in spring since much of the hydro is "must run" = use it or lose it as EdF remarked to me some years ago. Which will make the problem worse for France as it, in theory, builds out more renewables, yet another power block. As for "deamand flexibility" ... I recall assorted EU directors (Marie Connelly) whining on about this more than a decade ago - and assuming that markets would do it. They won't. You want a power system fit for purpose? you engineer it. Markets have little to no role, until the engineering is finished - they they do a bit of cost optimisation & even then - from the stats provided they do a poor job, under marginal pricing.