Some consequences of solar on the electricity markets
Impact on prices, solar value, imports/exports, power reserves, and curtailment of other generating assets.
Solar energy is growing rapidly, bringing significant consequences for electricity markets. Solar power is obviously generated only during the day and is almost negligible during winter months in countries far from the equator compared to spring and summer months1. This leads to a repeated pattern of daily fluctuations, except maybe during the winter months2. Many are familiar with the effect on load and electricity prices, often referred to as the infamous “Duck Curve.” In this post, I will go deeper, exploring some lesser-known yet logical consequences of the solar boom.
The solar growth
In a recent The Economist article, there has been a special emphasis on the spectacular growth of solar. Here is an extract:
To call solar power’s rise exponential is not hyperbole, but a statement of fact. Installed solar capacity doubles roughly every three years, and so grows ten-fold each decade. Such sustained growth is seldom seen in anything that matters. That makes it hard for people to get their heads round what is going on. When it was a tenth of its current size ten years ago, solar power was still seen as marginal even by experts who knew how fast it had grown. The next ten-fold increase will be equivalent to multiplying the world’s entire fleet of nuclear reactors by eight in less than the time it typically takes to build just a single one of them.
With solar manufacturing capacity expected to exceed 1 TW per year in 2024, it is likely that solar panels will flood the market, leading to extremely low prices for additional solar installation. The Economist rightly notes that many people struggle to grasp the scale of the solar boom, making it difficult to fully comprehend and predict the impact of this solar revolution.
Specifically, our electricity systems will likely shift between solar-based power and "traditional" power sources on a daily basis. To understand this daily shift, it is interesting to study key metrics broken down by hour. The present post will do such an analysis of market prices, solar value, power trades, the cost of power reserves, and the reduced reliance on other power sources. The implications are extensive, as solar energy is fundamentally transforming the electricity sector.
The direct impact: the market price
The most significant impact, often referred to as the "duck curve," is the lowering of day-ahead prices when solar power generation is high. Electricity prices on organized exchanges, like other commodities, are determined by the intersection of supply and demand and are set by the marginal cost of the last selected supplier (and consumer). Since solar power has virtually zero marginal cost3, increased solar production leads to lower market prices. This effect is clearly illustrated in the graph below4.
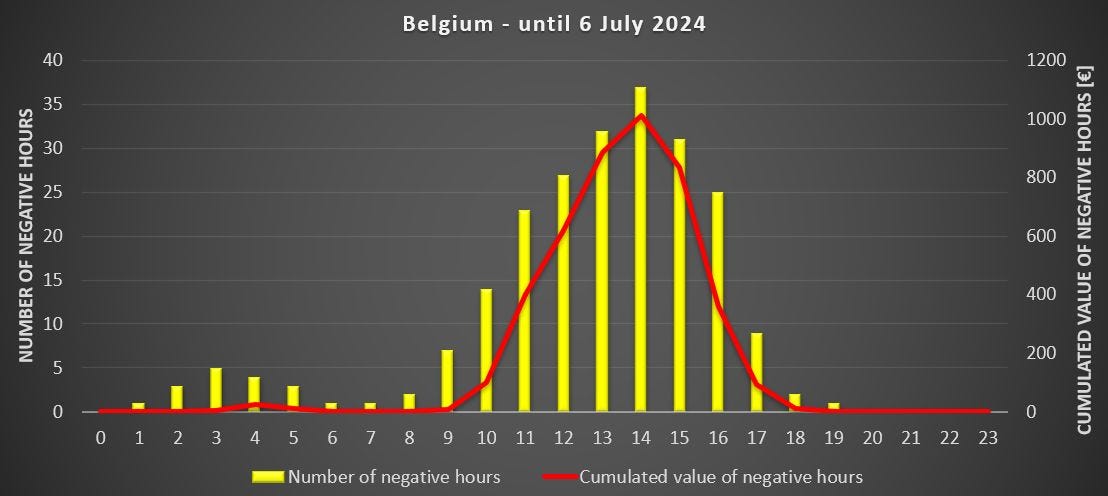
As solar is still often encouraged to keep producing even in case of clear oversupply, we are facing some episodes with large negative hours. On 3 July, Belgian attained a record low price of -140 €/MWh (the record for 2024 so far).
This can be measured by the number of negative hours as well as the cumulated value of all these negative hours. Hereunder is the information depicted per hour of the day for Belgium in 2024 (until 6 July included). Negative prices happen during 228 hours (around 5% of the time) for a cumulated value of -4375 €/MW, or about -1 € per hour. Focusing on the most impacted hour, 2 PM, there have been 37 hours (19 % of the time), for a cumulated value of -1013 € or -5.2 € per hour5.
Consequence 1: The maximal value is not equal to the maximal production
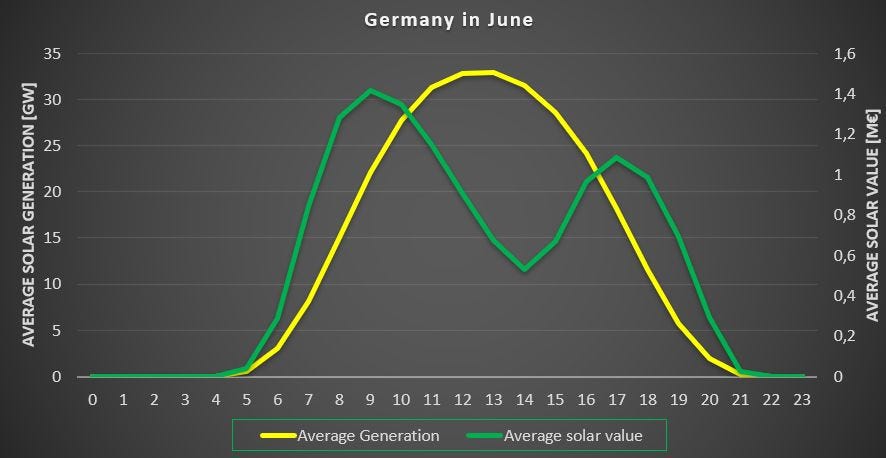
One fundamental element to keep in mind is that the maximum value of solar generation does not occur anymore when solar production is at its peak6. The graph below illustrates the solar value for each hour, calculated as the product of solar generation and market price.
It is evident that solar is most valuable, in terms of market value for that particular month, during the morning and, to a lesser extent, the evening peaks. This is because increased solar production does not fully offset the lower market prices that occur during periods of high generation.
This graph supports the argument for installing solar panels with different orientations, such as vertical East-West. While these installations might produce less overall (resulting in a higher Levelized Cost of Energy, or LCOE), they would offer greater market value due to better alignment with peak demand periods.
Consequence 2: the import-export position
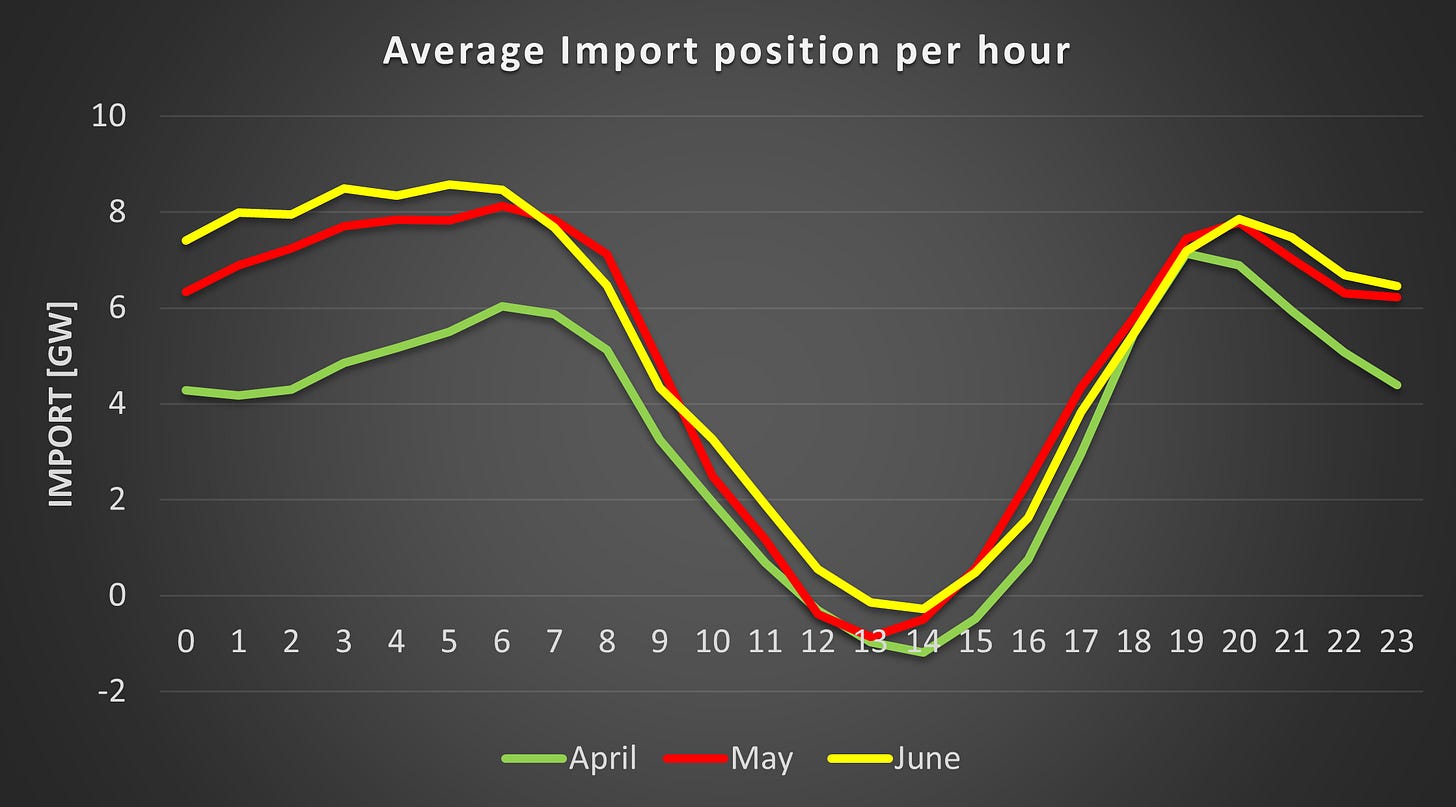
Another interesting aspect is the import/export dynamics of Germany, which boasts the largest solar fleet in Europe with over 1 kW per capita and 89 GW of installed solar capacity. During sunny hours, Germany transitions on average from a high import position, exceeding 8 GW on average in the morning, to a slight export position in the afternoon.
If you compare the export/import positions by hour, the scatter plot below illustrates this relationship. Each point represents one hour. The trend is clear: importing power generally occurs at much higher market prices than exporting. Interestingly, all the hours with significant negative prices coincide with substantial export positions, as seen in the lower left part of the graph. This post describes this phenomenon more in detail.
Consequence 3: the increasing cost of power reserves, or the reserve duck curve
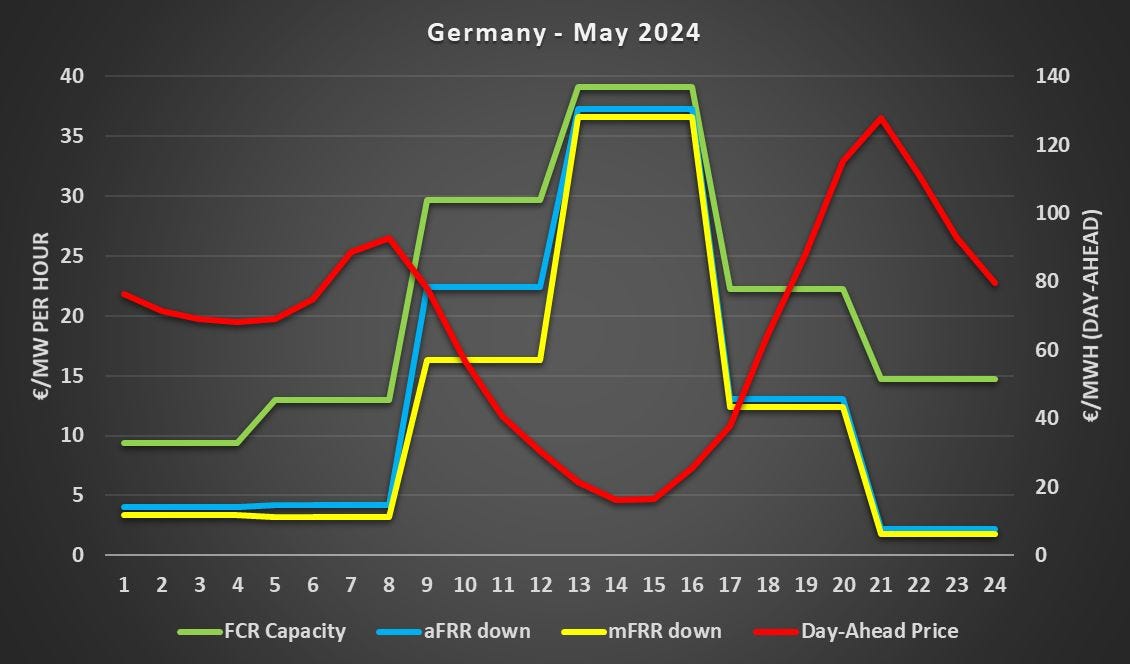
Transmission system operators must procure in Europe power reserves to regulate the power systems and keep the balance between consumption and generation. There are different reserves with various characteristics from FCR to mFRR7. Grid operators must procure at any moment a certain amount of each reserve. As solar is displacing traditional assets, such as gas power plants, we are observing a relatively sharp increase in the price of some of the power reserves, which happens in the opposite direction than the prices on the day-ahead markets.
With the rise of batteries, this situation might not hold as batteries might deliver a large chunk of the needed power reserves. For more insights on power reserves, see here for FCR and aFRR.
Consequence 4: other assets produce less
A further logical consequence is also the lesser use of other assets during the afternoon hours, including for the assets that have very low marginal costs, such as nuclear and offshore wind. In the graph below, we can see that nuclear power reduces its output during the afternoon in spring, which is the consequence of lower prices on the day-ahead markets8.
The following graph is for offshore wind in Germany. We can distinguish a slight decrease during the afternoon hours. This might not only be due to solar provoking lower prices but also simply to lower wind in the afternoon. Nevertheless, it is undeniable that the former effect is happening, as you can see for the 12 May 2024 in Germany for example9.
A similar effect can also be observed for large solar parks when proper economic incentives are present10.
The main idea: averages are becoming less useful
As we are shifting towards a system that fluctuates daily from a solar-based system to a more traditional power system, the use of averages is increasingly insufficient. For example, presenting only the average day-ahead price over a month without showing the potential huge variation between lows and highs is far from enough to understand the dynamics of the electricity markets11.
This is true for most interesting variables, including the value of solar for example, and by extension, the use of LCOE, as I explained in this post. Indeed, to understand the benefits of a solar project without subsidies, it is interesting to compare the expected value of solar with the LCOE. Such a comparison might lead to preferring original orientations, maybe with higher LCOE but bringing more value.
I hope that you enjoy reading this post. Feel free to reach me for further discussion.
Every country is different. Southern European countries have much better irradiation in winter, and therefore the impact can already be felt in February/March. In summer, it is the other way around as the load is generally higher in summer during the day (air conditioning) leading to a lesser impact in the Southern countries.
Winter months can be very poor in terms of solar energy. In Germany, the best month for solar generally yields up to 10x more than the worst-performing month.
In many instances, there are incentives to continue producing even when prices are negative. See this post.
Concretely, the -1€ means that the yearly average is reduced by 1 € simply because of negative hours, and by -5.2 € if we only look at the hour of 2 PM.
When solar was negligible, solar did not influence much market prices, and therefore, the maximal value was obtained when production was at its peak.
Power reserves are not yet well harmonized across Europe. In some countries, there is also the RR.
This graph presents averages over the month per hour, some days are much more impacted than others, depending on the market prices.
The difference between forecast and real production is very large during episodes of negative prices, suggesting that economic curtailment happened. See here.
This is especially true when peak hours become more expensive due to the incorporation of start-up costs (amongst other things) and hence, the average might not decline much.


Interesting piece thanks
I’ve noticed this dynamic seems to have many fossil and nuclear proponents dunking on renewables as unworkable. But we’ve know the intermittent nature of solar and wind. This is nothing new.
Obviously storage is necessary. And it occurs to me that it will not be the domain of renewables only. Traditional operators, if they are getting paid more, will benefit from adding storage so they can deliver more flexibly around solar generation maximums.
The marginal market "a tool for selecting efficiently the cheapest power plants for a given electricity mix". It would be helpful to define "efficiently" in this context. Keeping in mind, any & all market prices should reflect production costs for what is sold. Elec markets, as is, don't. Indeed a marginal market is functionally incapable of delivering prices that reflect production costs - empirically this can be seen every single day. I'm not offering "a point of view", I am saying that the data shows that marginal markets have failed, &did so quite some years ago & actions to remedy the failure are "sticking plasters over gaping wounds". That nothing substantial is done is a reflection of both the force of the trader lobby and the incapacity of many observers of what is happening - who seem to take a quasi-religious attitude to marginal markets - while ignoring the numbers. The numbers don't lie.