Capture price of renewables: miscellaneous
A review of various sources with interesting info on capture prices
The initial motivation behind creating this Substack was to introduce the concept of the solar cannibalization effect, explored in two parts (part 1 and part 2), and to provide data illustrating this phenomenon1. In this post, we continue this endeavor by presenting various information supporting our observation on the declining capture price of wind and especially of solar. We do not pretend to be exhaustive as there are many analysts concerned by these developments. Furthermore, our objective is not to portray renewables in a negative light, as we hold a positive perspective on their potential. Instead, we aim to shed light on a critical aspect that should be considered when striving for higher levels of renewable energy integration.
The concept of capture prices
First of all, let’s recap what is the capture price.
In the European electricity landscape, the operational backbone revolves around day-ahead markets. These markets function through daily auctions, establishing pricing for each hour within every geographical zone2 for the following day, the so-called day-ahead market.
For each hour of the day, we have access to data detailing the energy production from various sources, encompassing solar, wind, gas, coal, nuclear, and more. By marrying the production profiles with pricing data, we can calculate the capture value of this production. The capture value can be succinctly defined as the value (in €) captured per unit of generation (in megawatt-hours, MWh). This capture value can be expressed both in €/MWh and as a percentage, by comparing it to the average market price3. In other words, the capture price encapsulates the day-ahead market price, weighted by the generation profiles of the different energy sources.
Crucially, solar and wind energy sources possess close to zero marginal costs4. Consequently, as their output increases, market prices tend to decrease. A discernible relationship exists between the residual load, which represents the total load minus wind and solar contributions, and the resultant market prices. Hence, as the penetration of solar and wind energy escalates, we observe a consistent trend of diminishing market prices.
Because solar is more concentrated and more correlated in a relatively small continent like Europe, we observe a faster decrease in the capture value for solar, especially with the coming surge of solar capacity. Check out our previous posts for more info:
Future prices: lower price for peak in Q2 and Q3
Firstly, we can observe that electricity markets are starting to incorporate the lower value of solar during months with high solar production such as the second and third quarters. In numerous countries, electricity markets for future delivery5 traditionally trade two distinct profiles: baseload and peak. The peak profile encompasses the hours between 8 AM and 8 PM, effectively incorporating solar energy production. Therefore, when solar energy exerts an influence on power markets, it should have a more pronounced impact on peak prices.
Historically, peak electricity prices have tended to surpass baseload prices, reflecting the higher demand during peak hours. However, with the emergence of solar energy, an intriguing trend unfolds: during sunny months, peak prices are on the decline. As an illustrative example, consider the future price dynamics for the Netherlands as of October 26, 2023. It's evident that prices for the first and fourth quarters continue to exhibit a significant gap between peak (depicted by the orange boxes) and baseload prices, whereas, during the second and third quarters, the peak profile is now trading at a discount compared to baseload (indicated by the yellow boxes).

Capture prices in Spain
If we zoom into individual countries, Spain and Portugal will likely stand out as they are relatively less connected to the European main grid. Indeed, the Iberian peninsula will particularly be affected by solar cannibalization.
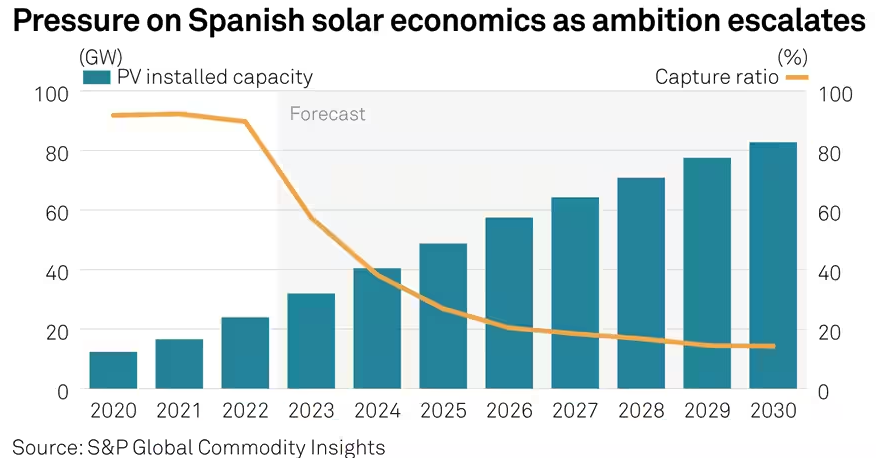
S&P Global reports that “solar PV, annual capture rates will fall from 90% harvested in 2022, 80% so far in 2023 to below 20% after 2026, rising above 25% only after 2040.”
What is interesting in this forecast is the non-linear effect, somehow like an inversed S-curve, with a rapid decrease of the capture price in the coming years to finally stabilize at around 20%. It should be emphasized that 20% means a capture value of around 12 €/MWh as currently, the future baseload prices in Spain are around 60 €/MWh for 2027 and after.
Capture prices in Germany
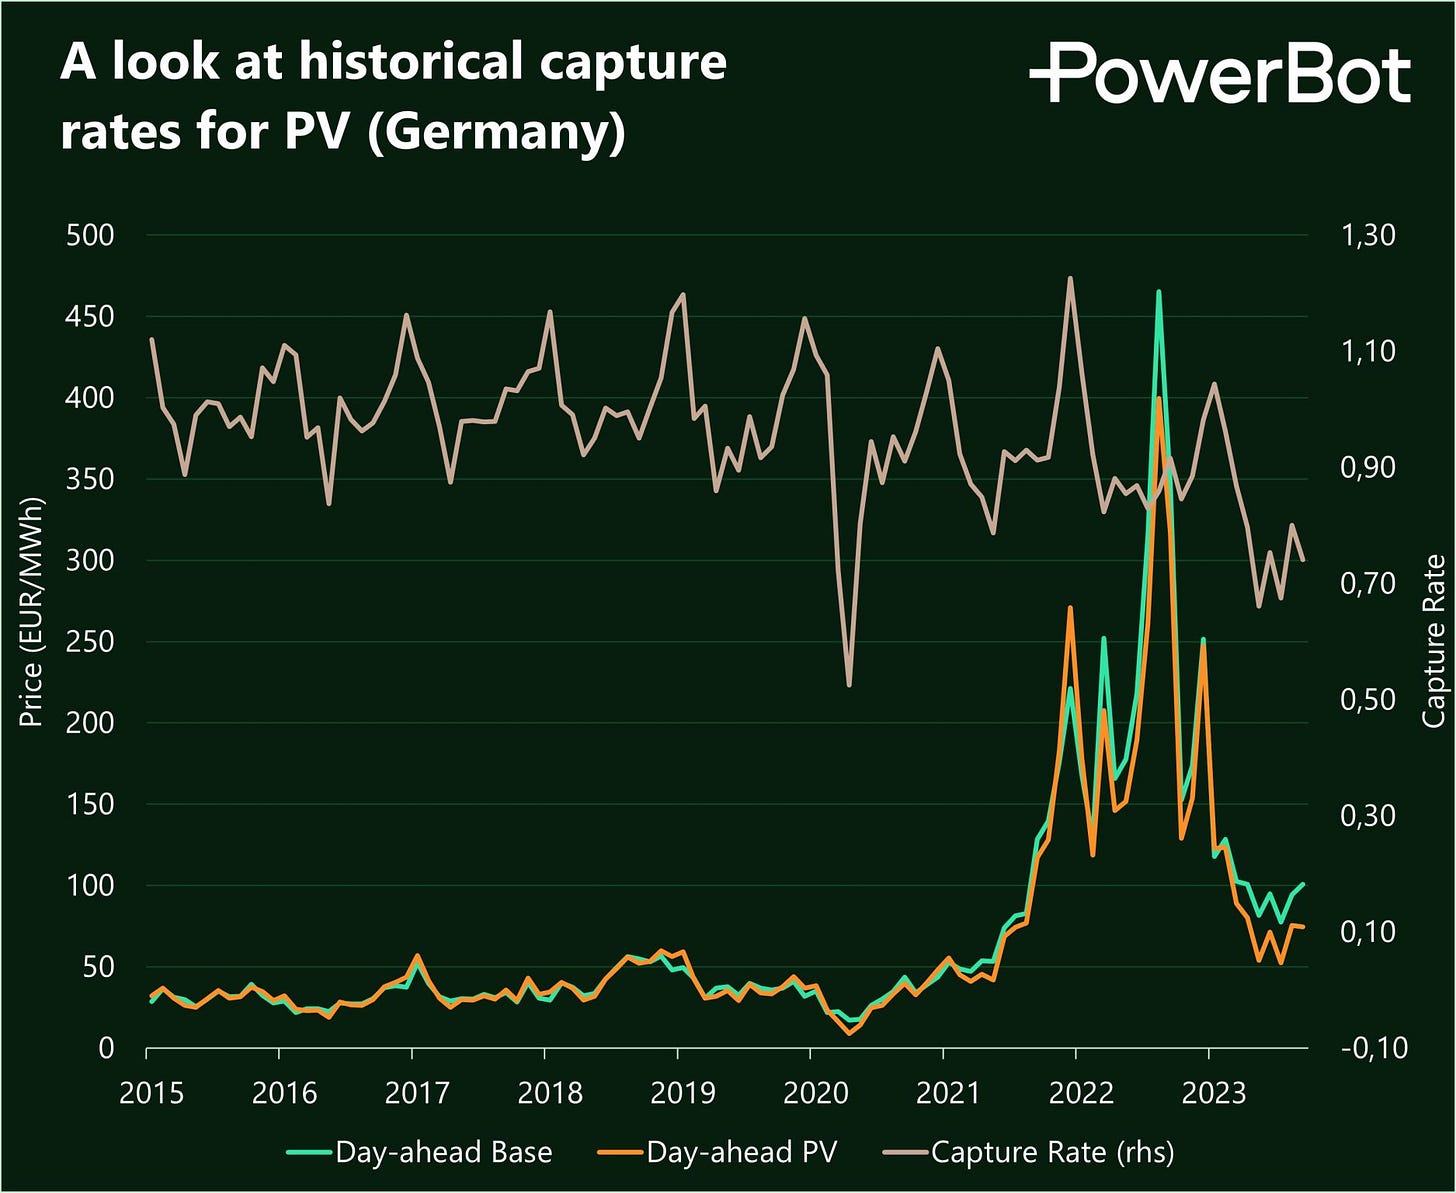
The company Powerbot has published posts on capture rates for Germany. We can clearly see a cyclical trend (capture prices are higher during winter and lower in spring/summer) and an overall diminishing trend with increased penetration of renewables. There is one exception for March/April 2020 corresponding to the Covid situation. Powerbot wrote in their post:
The downward trend for the wind capture rate is not that easy to detect - however, it is definitely there. But for PV, price cannibalism is brutal, as the production profile is rather stable.

The website Energy-Chart also publishes data on the market value of solar compared to the spot prices. Hereunder is the graph for the year 2023 until August. As we can see, the worst months in terms of decreased value compared to spot market price were May and July 2023, interestingly the months where the electricity exports were worth the least (see my previous post).
Furthermore, the German TSOs published an estimation of the cost to support renewables, called EEG. In this estimation, they assume a Marktwertfaktor, which corresponds to the capture rate. They estimate it at 83% for solar, 92% for offshore wind, and 89% for onshore wind for the year 2024. Here is a summary of the 2024 estimation for the EEG on Twitter/X.
Financial instrument for hedging the capture risk
Interestingly, Statkraft, an energy company, and Munich Re, a reinsurer started to trade an innovative financial swap:
To mitigate the volatility in price, one method is to trade baseload power alongside a Quality Factor financial swap. This swap fixes the ratio of the achieved price for selling renewable power compared to baseload power, ensuring revenue certainty at the time of pricing.
This is certainly a kind of financial product that will grow with the increased penetration of wind and solar.
The tool from Sønderup Consult
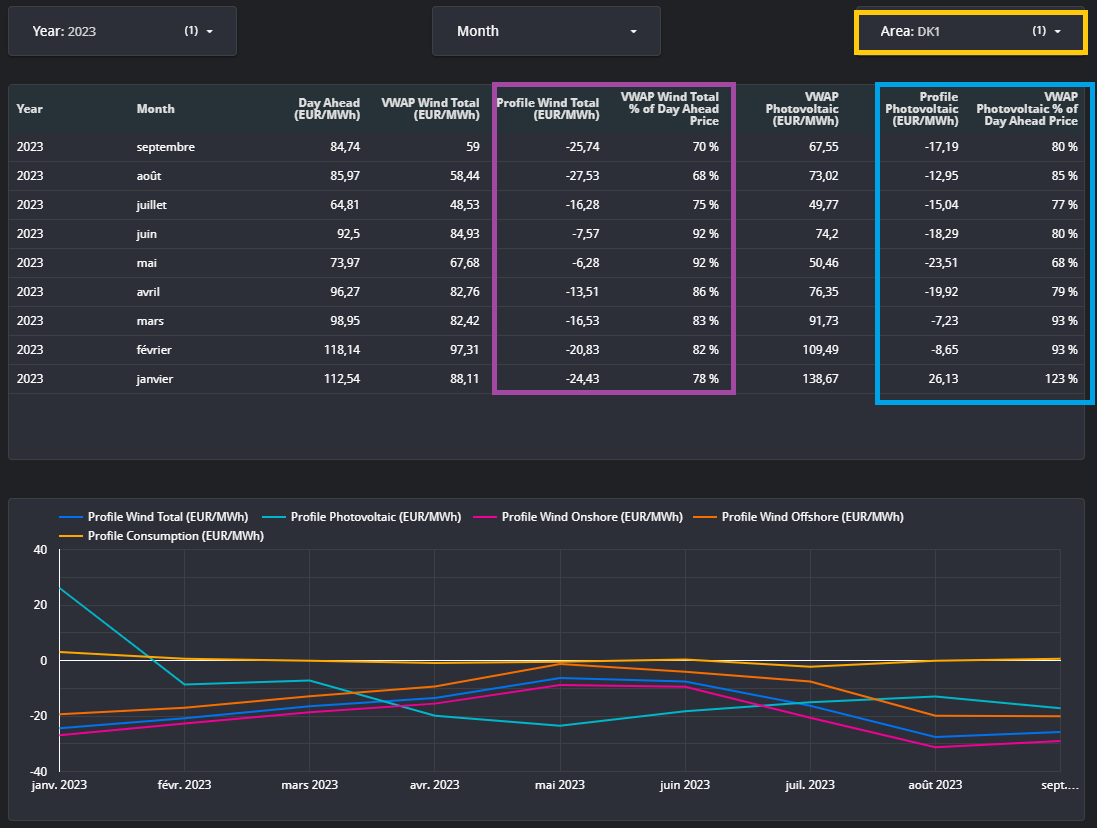
Sønderup Consult has an interesting tool on its website where we can see the capture values for wind and solar in the Nordic countries, the UK, Germany, and the Netherlands. Hereunder is a snapshot of one of the two zones of Danemark (DK1) for the year 2023. It presents both the reduced value in €/MWh and % compared to the market price. Interestingly, the month of May 2023 was clearly the worst month for solar in the zone (DK1) with a capture rate of only 68%. This is somehow similar to the German case presented above.
The tool from Intermittent.energy
The website intermittent.energy presents some interesting visualizations of the capture rates in Europe. Hereunder are the 3-month solar capture rates for solar in Germany, France, and Spain, both in €/MWh and in % of the day-ahead market price. We can clearly see the increase of capture rates in absolute terms due to the energy crisis, with France having a premium due to the nuclear underperformance in 2022, and Spain avoiding a peak during summer 2022 due to the cap on gas prices on the Iberian peninsula.
When we look in relative terms, we can see the trend of decreasing capture prices in the three countries.
The Australian case
Australia offers an interesting case as the penetration of solar and wind is reaching a substantial level in some areas. Hereunder is a snapshot of one part of the Australian grid, namely South Australia. We see that for the month of October, the capture value of solar is negative for both rooftop solar and utility solar. The reason why rooftop solar is achieving a much lower value in $/MWh is due to the lack of controllability. Indeed, utility-scale solar is doing economic curtailment when prices are negative while rooftop solar is not.
The counterfactual
The paper here describes the cannibalization effect as entirely avoidable. While the paper reckons that price cannibalization can be a problem, the authors suggest focusing on carbon pricing and flexibility. They point out three elements:
Ensure carbon allowances and thus carbon prices are aligned with climate targets.
Design renewables support in a smart way, to ensure real-time prices are undistorted.
Remove obstacles to flexibility and invest in interconnection and market integration.
We completely agree that these measures will influence positively the capture prices of renewables. Nevertheless, it remains to be seen to which extent policymakers will implement them (the first two) and to which extent flexibility and interconnections will materialize fast enough.
Later on, we moved to other related topics, which are somehow consequences of this effect such as the contract-for-difference, the concept of Levelized Cost of Electricity (LCOE), and the import/export balance.
A zone generally corresponds to one country but not necessarily.
The average price is the capture price of the baseload.
Even negative marginal costs if the support scheme is, for example, a market premium, a premium given to the producer independently of the market price. See the example of Australia.
See this website for more information on future products.


Thanks for an excellent resource. Curiously, looks like the Spanish PV fleet didn't benefit at all from the 2022 price spike, while those in France and Germany did. Why is that? Fixed feed-in tariff with no merchant exposure?
Great post! I love that you use multiple sources that support your argument regarding decreasing capture rates by solar.